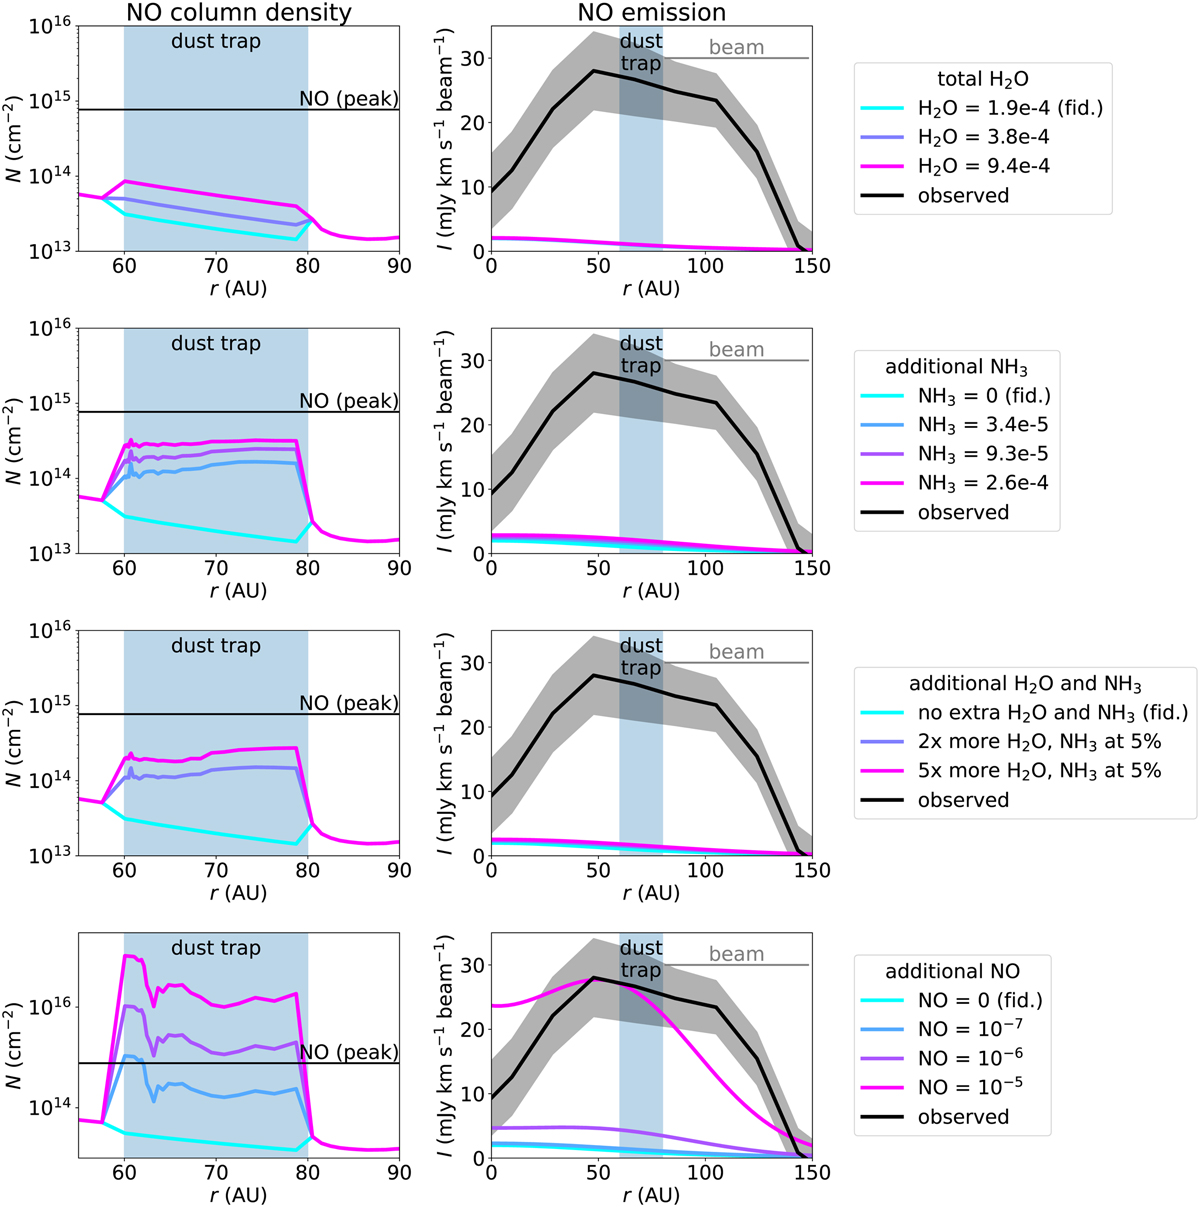
Fig. 11
Download original image
NO column density (left) and emission (right) for the dust trap models with different initial conditions. The different rows indicate the effect of additional H2O (first row), NH3 (second row), H2O and NH3 (third row), and NO (final row). The NO column density in the bottom row is dominated by that hidden underneath the τdust = 1 layer. The chemical network inside the dust trap is evolved for 100 yr whereas that outside is evolved for 1 Myr. The horizontal black line in the left column indicates the NO column density derived from the observations and the black line in the right column indicates the observed emission. Note: a difference is apparent in the vertical axis of the bottom left panel.
Current usage metrics show cumulative count of Article Views (full-text article views including HTML views, PDF and ePub downloads, according to the available data) and Abstracts Views on Vision4Press platform.
Data correspond to usage on the plateform after 2015. The current usage metrics is available 48-96 hours after online publication and is updated daily on week days.
Initial download of the metrics may take a while.