Fig. 1
Download original image
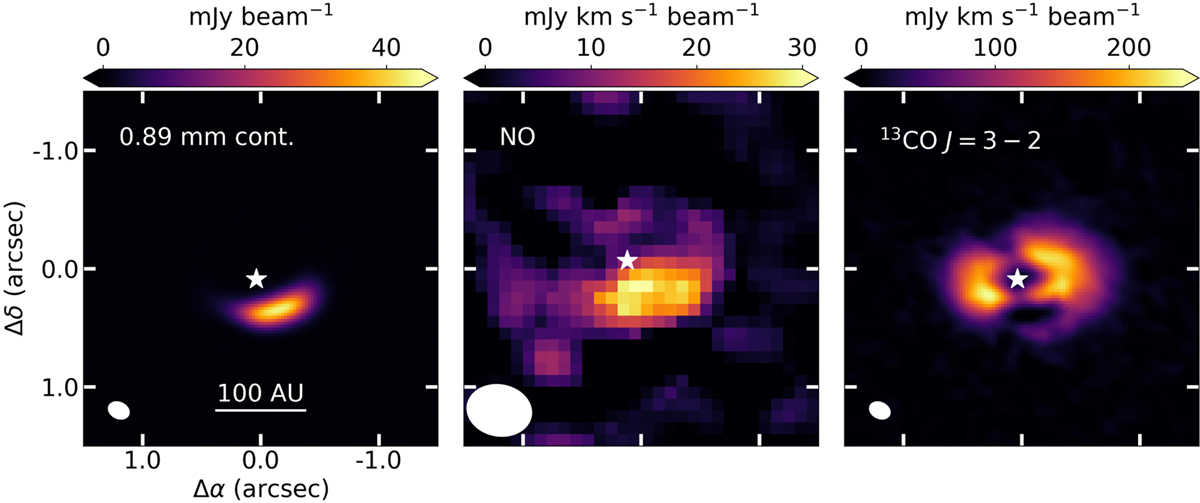
Dust and gas observations in the IRS 48 disk. Left: 0.89 mm continuum emission showing the major asymmetric dust trap in the south. Middle: Moment 0 map of the sum of the three NO lines at 351.1 GHz. Right: Moment 0 map of the 13CO 3 − 2 transition. The position of the star and the beam of the observations are indicated with the white star and the white ellipse, respectively, in each panel. A 100 AU scale bar is indicated in the bottom of the left panel.
Current usage metrics show cumulative count of Article Views (full-text article views including HTML views, PDF and ePub downloads, according to the available data) and Abstracts Views on Vision4Press platform.
Data correspond to usage on the plateform after 2015. The current usage metrics is available 48-96 hours after online publication and is updated daily on week days.
Initial download of the metrics may take a while.