Open Access
Fig. 9.
Download original image
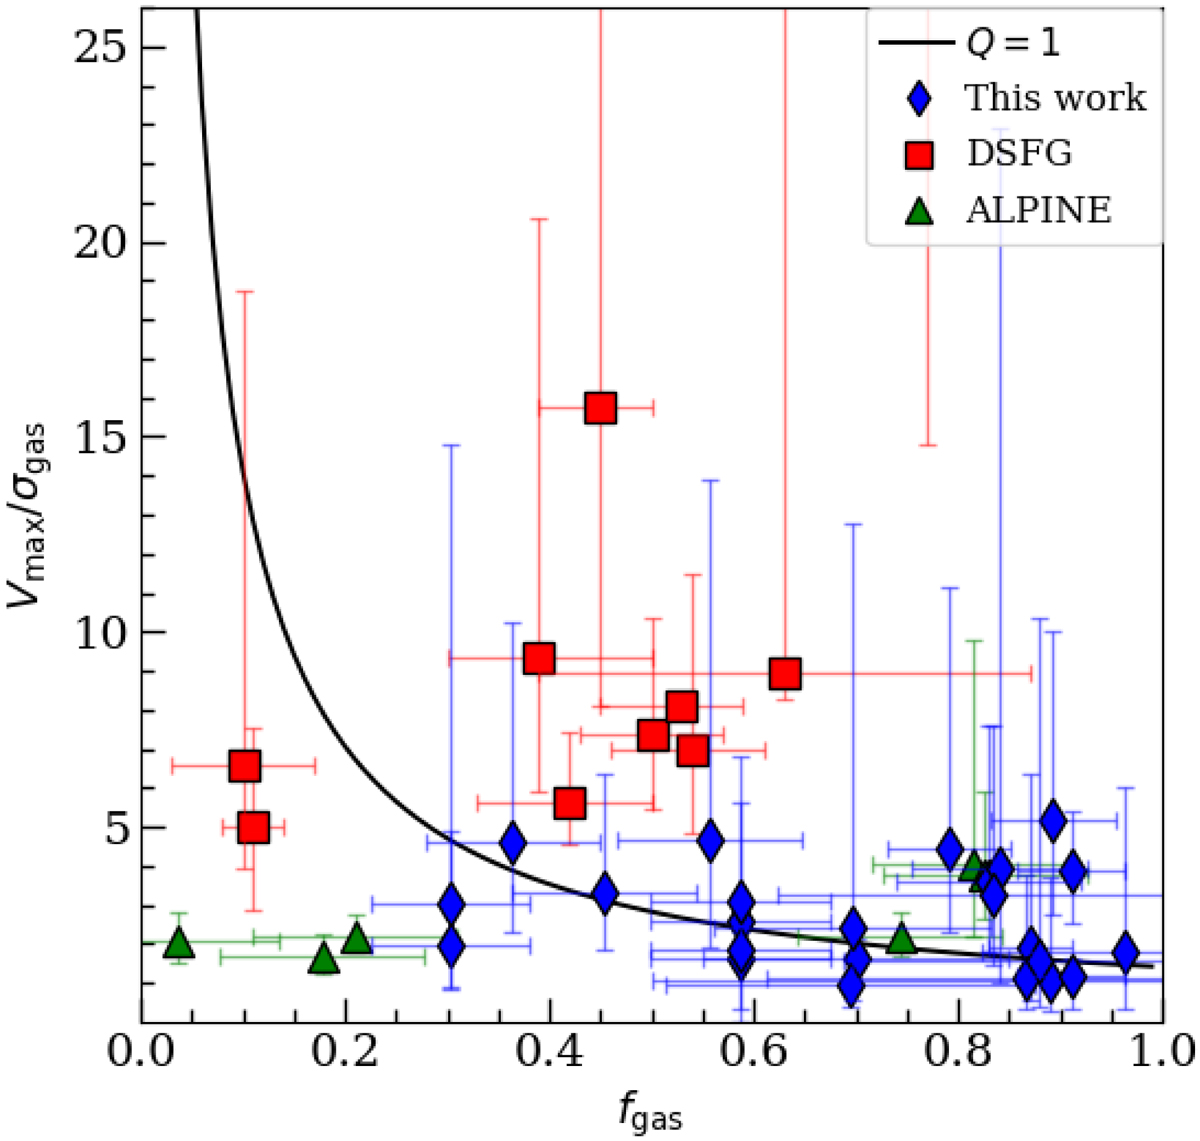
Vmax/σgas as a function of gas fraction. The black line represents the model by Wisnioski et al. (2015) with the assumption of Q = 1 and ![]() . In dark blue, we show the data obtained from the sample of galaxies targeted in this work.
. In dark blue, we show the data obtained from the sample of galaxies targeted in this work.
Current usage metrics show cumulative count of Article Views (full-text article views including HTML views, PDF and ePub downloads, according to the available data) and Abstracts Views on Vision4Press platform.
Data correspond to usage on the plateform after 2015. The current usage metrics is available 48-96 hours after online publication and is updated daily on week days.
Initial download of the metrics may take a while.