Open Access
Fig. 8.
Download original image
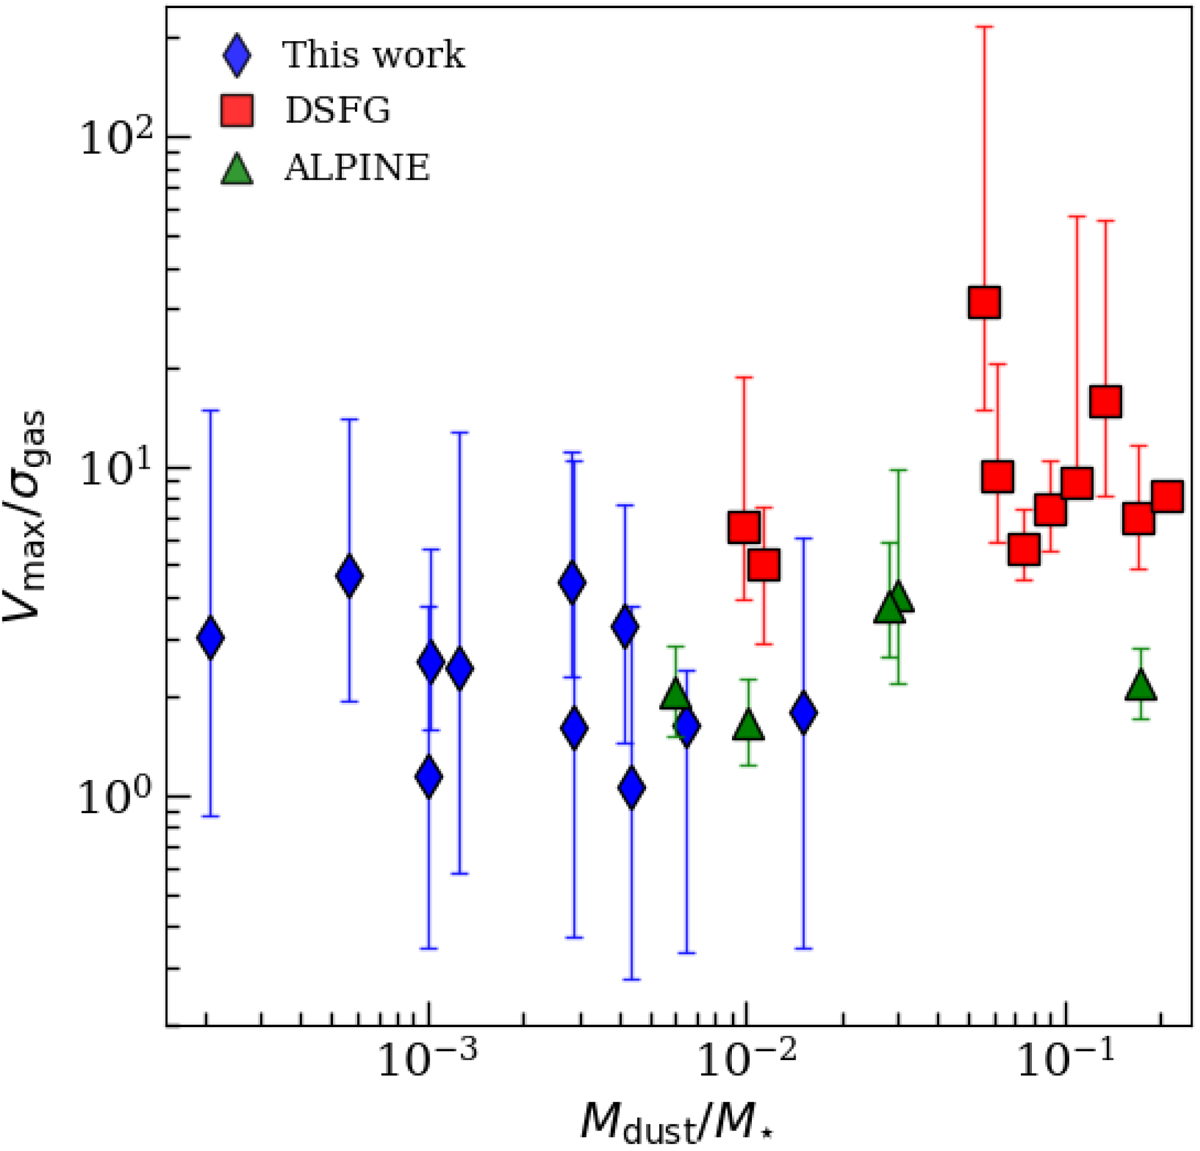
Vmax/σgas as a function of redshift, and the ratio of the dust mass and stellar mass. In red we show the DSFG sample (Sharda et al. 2019; Rizzo et al. 2020, 2021; Lelli et al. 2021; Fraternali et al. 2021), in green we plot the ALPINE sample (Jones et al. 2021), and in blue we show the sample targeted in this work.
Current usage metrics show cumulative count of Article Views (full-text article views including HTML views, PDF and ePub downloads, according to the available data) and Abstracts Views on Vision4Press platform.
Data correspond to usage on the plateform after 2015. The current usage metrics is available 48-96 hours after online publication and is updated daily on week days.
Initial download of the metrics may take a while.