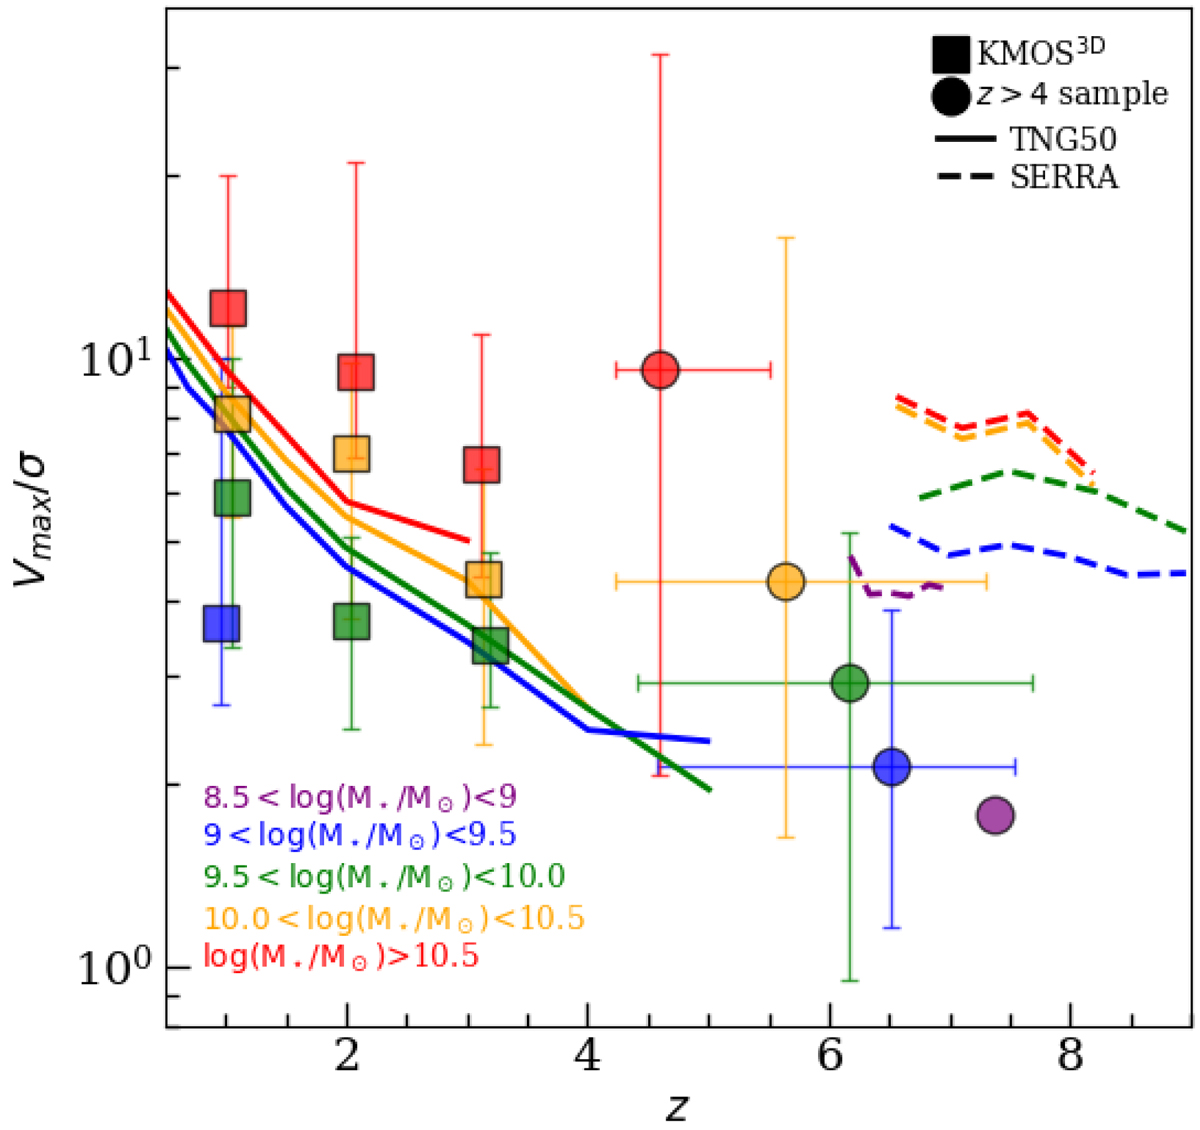
Fig. 7.
Download original image
Vmax/σgas as a function of redshift and stellar mass. Squares represent the results from KMOS3D (Wisnioski et al. 2019). Circles show the Vmax/σgas for the whole z > 4 sample including the results of this work. Solid lines show the results obtained by TNG50 simulations (Pillepich et al. 2019). Dashed lines show the results obtained by SERRA simulations (Kohandel et. al. in prep.). Different stellar mass bins are represented with different colors.
Current usage metrics show cumulative count of Article Views (full-text article views including HTML views, PDF and ePub downloads, according to the available data) and Abstracts Views on Vision4Press platform.
Data correspond to usage on the plateform after 2015. The current usage metrics is available 48-96 hours after online publication and is updated daily on week days.
Initial download of the metrics may take a while.