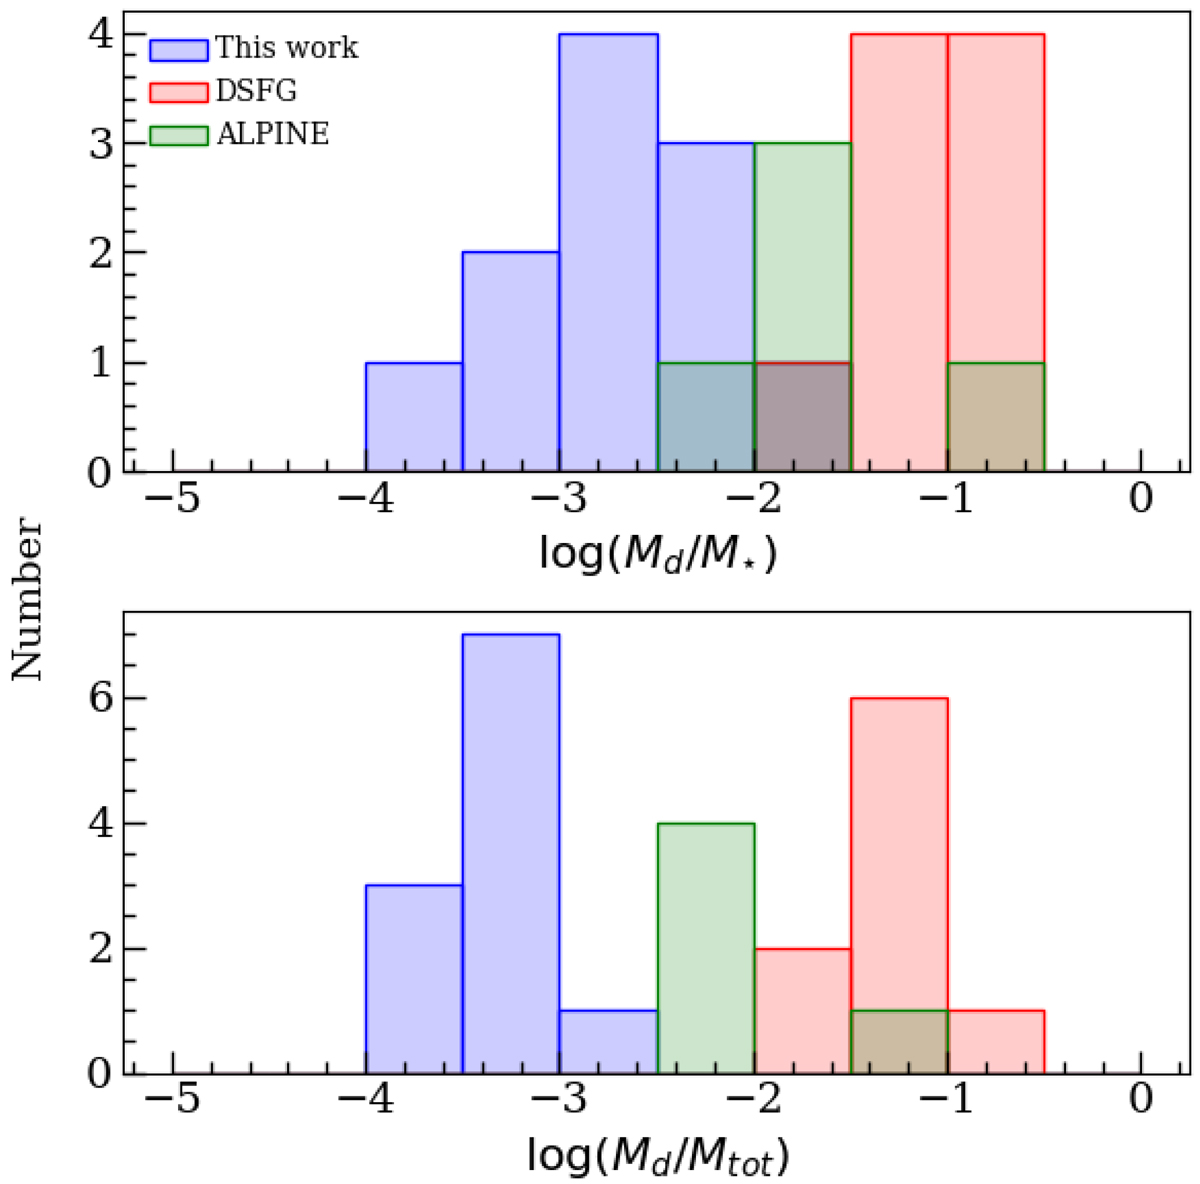
Fig. 6.
Download original image
Dust mass content in the three galaxy samples targeted in this work. In the upper panel, we plot the distribution of the ratio of the dust mass and stellar mass for the sample targeted in this work (in blue) and the sample of DSFG targeted by Rizzo et al. (2020, 2021), the starburst dusty galaxies (Sharda et al. 2019; Fraternali et al. 2021; in red), and the ALPINE sample (Jones et al. 2021; in green). In the lower panel we present the distribution of the ratio of the dust mass and total baryonic mass (Mgas + M*) for the sample targeted in this work, the sample of DSFG targeted by other high-z studies, and the ALPINE sample.
Current usage metrics show cumulative count of Article Views (full-text article views including HTML views, PDF and ePub downloads, according to the available data) and Abstracts Views on Vision4Press platform.
Data correspond to usage on the plateform after 2015. The current usage metrics is available 48-96 hours after online publication and is updated daily on week days.
Initial download of the metrics may take a while.