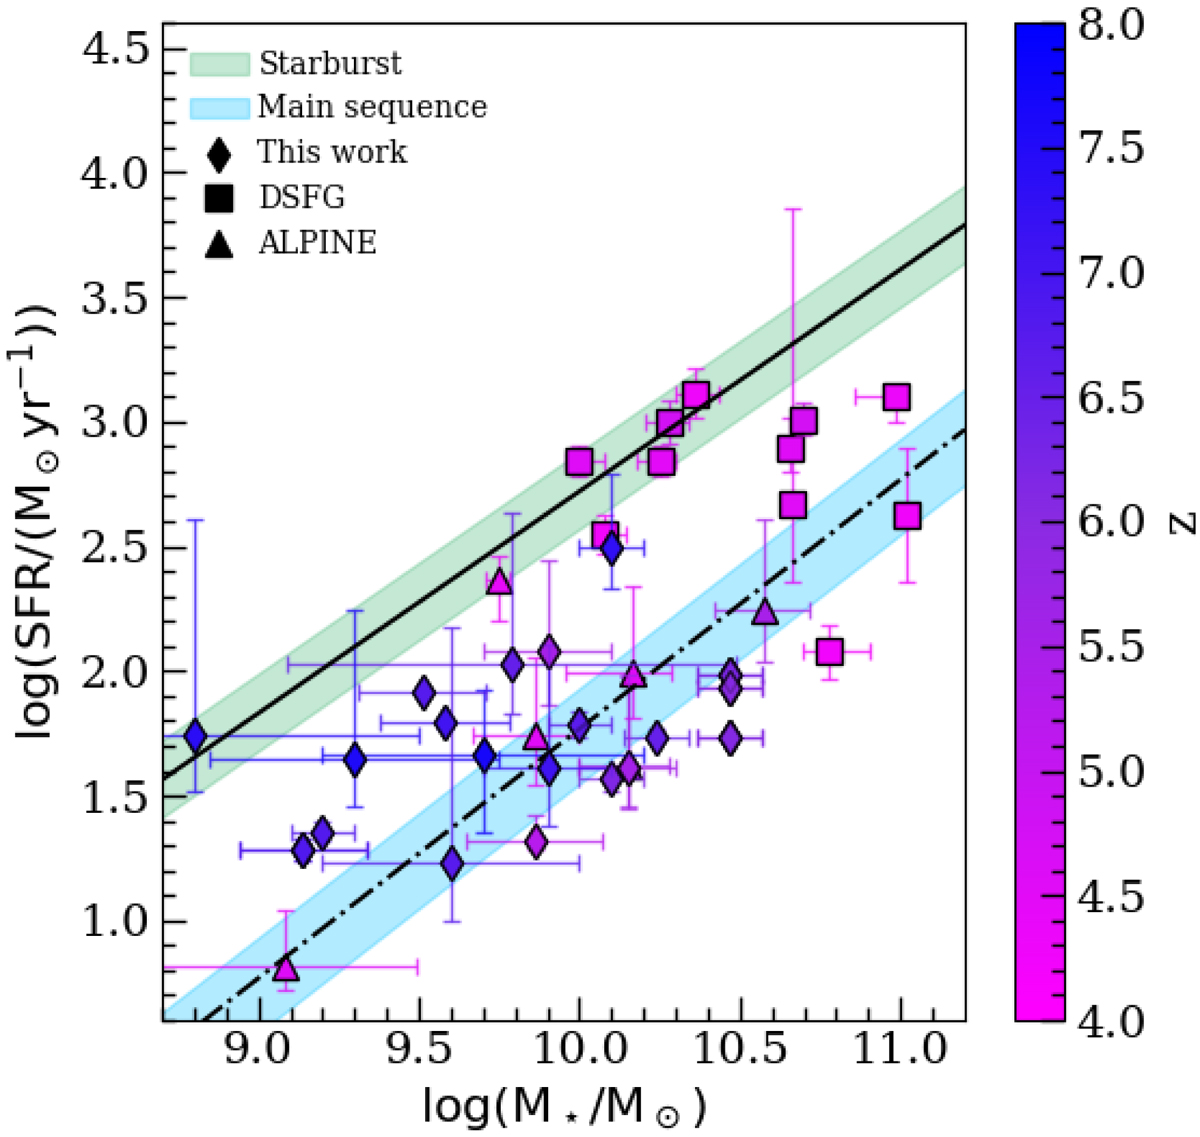
Fig. 5.
Download original image
SFR as a function of the stellar mass for our sample of galaxies and the results found in the literature. The colors represent the redshift on the galaxy (see the color bar). The diamonds are the galaxies targeted in this work. The squares show the results found by Sharda et al. (2019), Rizzo et al. (2020, 2021), Lelli et al. (2021), and Fraternali et al. (2021). The triangles show the ALPINE sample (Jones et al. 2021). In green we plot the starburst region at z ∼ 4 − 5 as predicted by Caputi et al. (2017). In light blue we plot the main-sequence region extrapolated between z ∼ 4 − 8 by Schreiber et al. (2015).
Current usage metrics show cumulative count of Article Views (full-text article views including HTML views, PDF and ePub downloads, according to the available data) and Abstracts Views on Vision4Press platform.
Data correspond to usage on the plateform after 2015. The current usage metrics is available 48-96 hours after online publication and is updated daily on week days.
Initial download of the metrics may take a while.