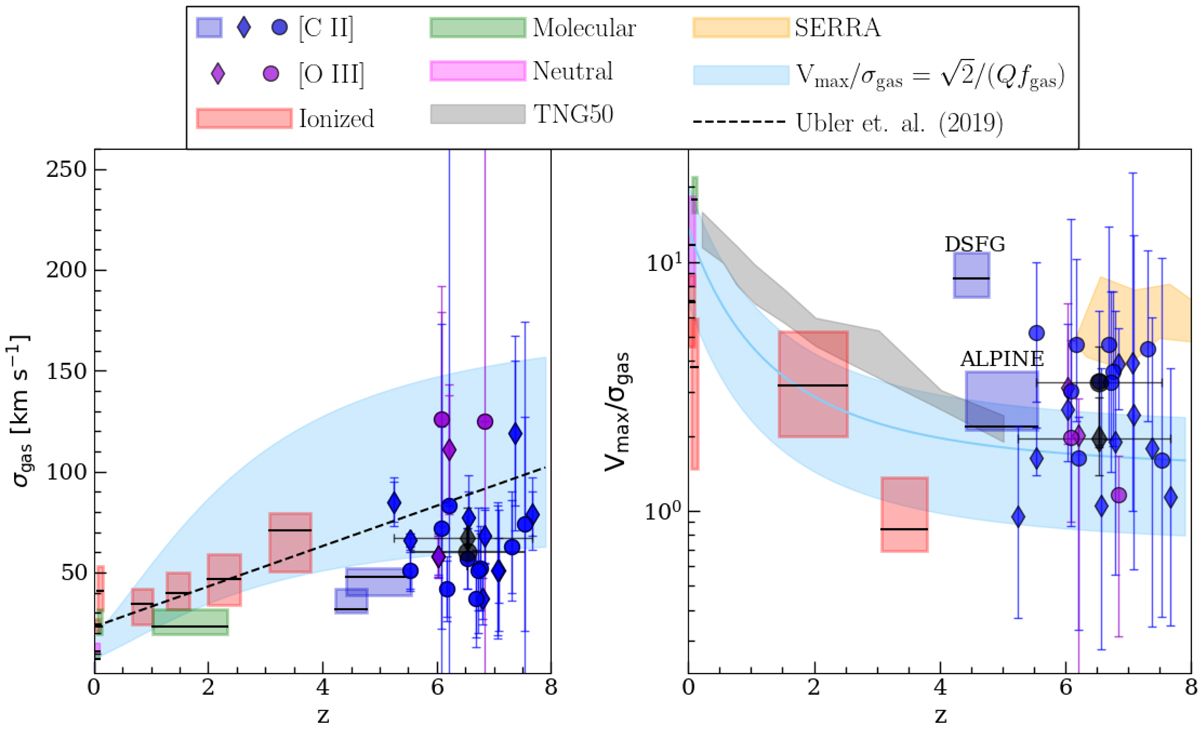
Fig. 4.
Download original image
Evolution of the velocity dispersion (left) and the Vmax/σgas ratio (right) with redshift. Blue and purple marks are the values obtained from our sample by analyzing the [C II] and [O III] observations, respectively. Diamonds are obtained by fitting the three moment maps (method I), and circles represent the results found for the marginally resolved galaxies (method II). Previous σ and Vrot/σ estimates reported in the literature are represented as color-coded rectangles: the observations with the [C II] emission line at 4 < z < 5 by Fraternali et al. (2021), Rizzo et al. (2020, 2021), Lelli et al. (2021), Sharda et al. (2019), and Neeleman et al. (2020) at 4 < z < 6 from Jones et al. (2021) are plotted in blue. Red rectangles show the results of the studies of ionized gas (Hα, [O III] λ 5007) in z < 4 galaxies (Epinat et al. 2010; Green et al. 2014; Turner et al. 2017; Übler et al. 2019). Green rectangles represent the measurements derived from molecular gas (Mogotsi et al. 2016; Girard et al. 2021), (CO). The pink symbols were derived with traced of neutral gas (H I) at z = 0 (Mogotsi et al. 2016). The boxes extend from the 25th to the 75th percentile of the data in the samples, and solid black lines show the median of the value. The light blue area represents the predictions by Wisnioski et al. (2015). The upper and lower boundaries of the shaded light blue region represent the predicted Vmax/σ (see Eq. (13)) for Q = 0.67 and Q = 2 and the solid light blue line represents the Vmax/σgas values predicted for Q = 1. The dashed black line represents the evolution of the best-fitting velocity dispersion trend by Übler et al. (2019). The gray and orange areas show the results obtained by the TNG50 (Pillepich et al. 2019) and SERRA simulations (Kohandel et al. in prep.), respectively.
Current usage metrics show cumulative count of Article Views (full-text article views including HTML views, PDF and ePub downloads, according to the available data) and Abstracts Views on Vision4Press platform.
Data correspond to usage on the plateform after 2015. The current usage metrics is available 48-96 hours after online publication and is updated daily on week days.
Initial download of the metrics may take a while.