Fig. F.1.
Download original image
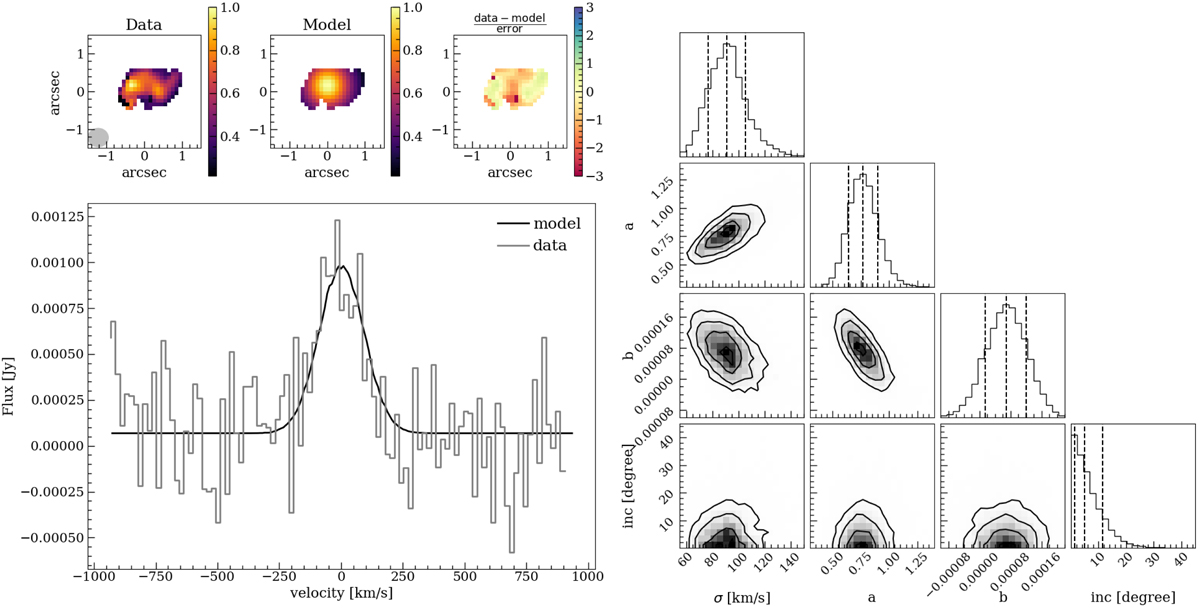
1D fitting results for the target VR7. In the left panel, we present the flux map at the top. From left to right, we show the observed flux, the model, and the residuals. The beam size is shown as the gray ellipse. At the bottom, we show the best-fit and the observed integrated spectrum. On the right, we show the corner plot of the free parameter of the fitting of the integrated spectrum.
Current usage metrics show cumulative count of Article Views (full-text article views including HTML views, PDF and ePub downloads, according to the available data) and Abstracts Views on Vision4Press platform.
Data correspond to usage on the plateform after 2015. The current usage metrics is available 48-96 hours after online publication and is updated daily on week days.
Initial download of the metrics may take a while.