Fig. 2.
Download original image
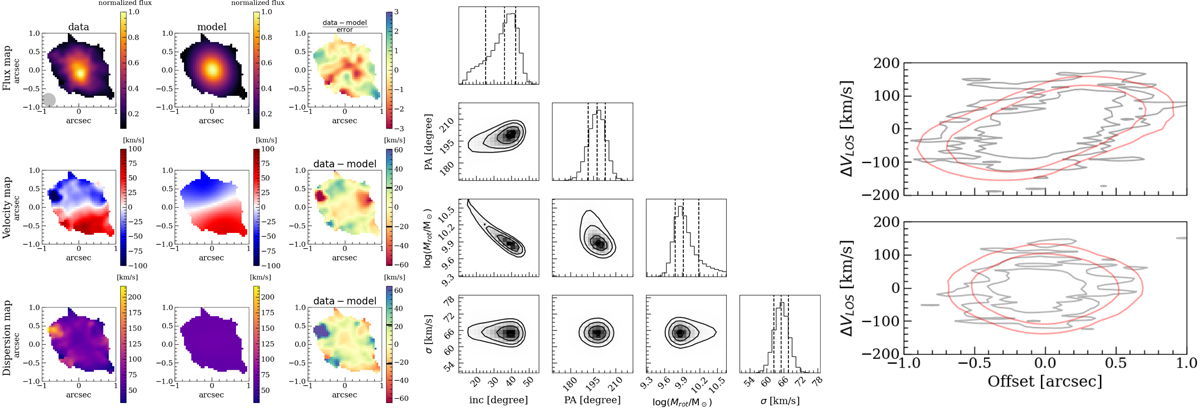
Best-fitting results of HZ4 obtained with method I. The left panels show the moment [C II] maps: the normalized flux map (top), the velocity map (middle), and the velocity dispersion (bottom). From left to right, the panels illustrate the data, models, and residuals. The color bars of the residual range between −3σ and +3σ, and the black lines indicate ±1σ. The ALMA beam is shown as the gray ellipse in the flux map. The multidimensional parameter space explored by step 3 of the method I algorithm is shown in the corner plot on the right.
Current usage metrics show cumulative count of Article Views (full-text article views including HTML views, PDF and ePub downloads, according to the available data) and Abstracts Views on Vision4Press platform.
Data correspond to usage on the plateform after 2015. The current usage metrics is available 48-96 hours after online publication and is updated daily on week days.
Initial download of the metrics may take a while.