Fig. E.1.
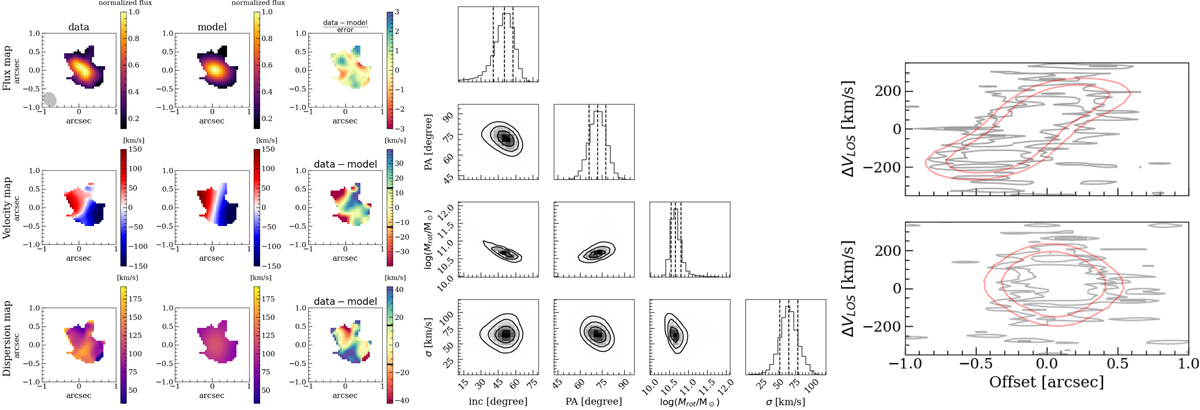
Download original image
Kinematic fitting using method I for COS-30 observed with the [C II] emission line. In the left column, we present the flux, velocity, and velocity dispersion map derived with the Gaussian fitting. The beam is shown as the gray ellipse in the flux map. In the central panels, we present from top to bottom the best-result maps of the zeroth, first, and second moment. In the right panels, we show the residuals of the fitting, with color bars ranging between ±3σ, the black line on the color bar indicates 1σ. The flux maps are normalized for a pixel with a maximum flux = 1. The x and y values of the kinematical maps are the measure in arcseconds from the central pixel of the image. In the center, we show the corner plot distribution of the free parameters. In the right panel, we show the position-velocity diagram along the major and minor axes in the upper and lower panel, respectively. In black we plot the data, in red we plot the model, and the contours are computed at 3 and 6 σ, respectively.
Current usage metrics show cumulative count of Article Views (full-text article views including HTML views, PDF and ePub downloads, according to the available data) and Abstracts Views on Vision4Press platform.
Data correspond to usage on the plateform after 2015. The current usage metrics is available 48-96 hours after online publication and is updated daily on week days.
Initial download of the metrics may take a while.