Open Access
Fig. C.2.
Download original image
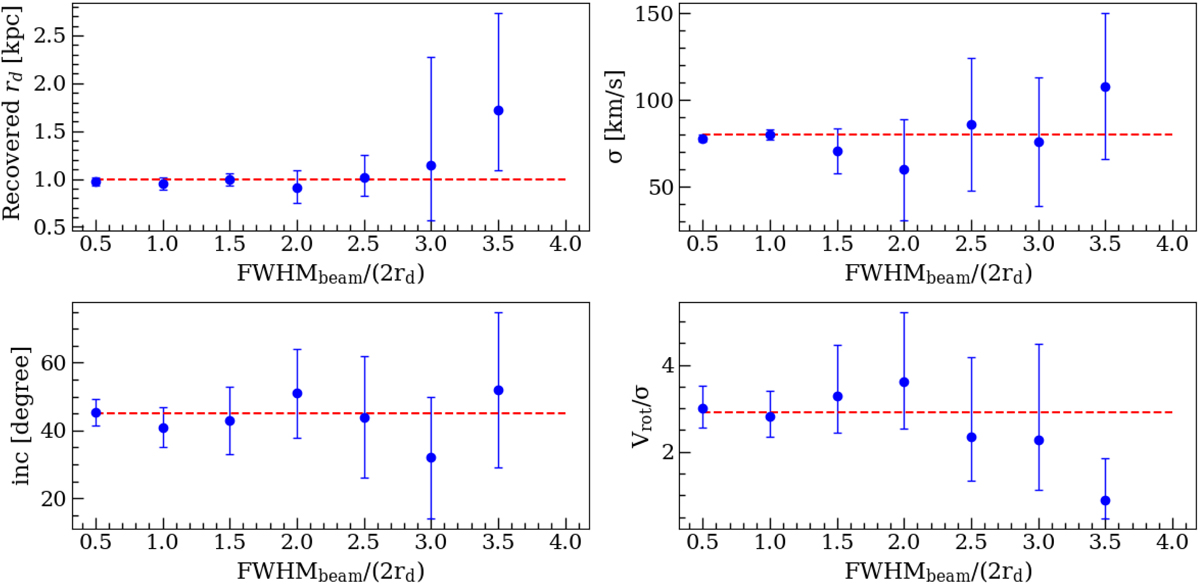
Best-fitting results of the scale radius (upper left), inclination (bottom left), σgas (top right), and Vmax/σgas (bottom right) for the mock datacubes with different FWHMbeam/2rd. The dashed red line represents the input parameters of the model we used to create the mock ALMA datasets.
Current usage metrics show cumulative count of Article Views (full-text article views including HTML views, PDF and ePub downloads, according to the available data) and Abstracts Views on Vision4Press platform.
Data correspond to usage on the plateform after 2015. The current usage metrics is available 48-96 hours after online publication and is updated daily on week days.
Initial download of the metrics may take a while.