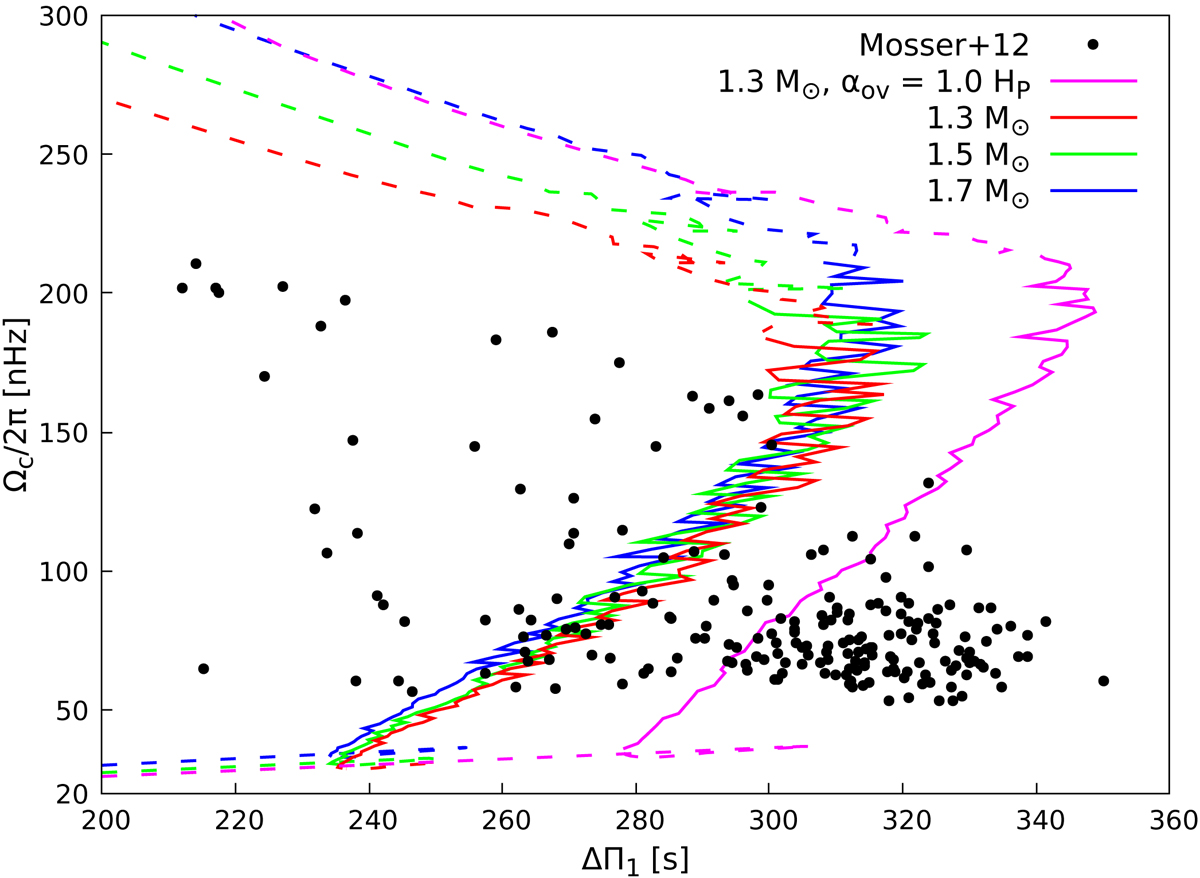
Fig. 9.
Download original image
Evolution of the core rotation rate during the core-helium-burning phase as a function of the asymptotic period spacing for different initial masses. The models correspond to those presented in Fig. 4. The solid lines show the region where the central helium decreases from Y = 0.9 to Y = 0.1. The evolution proceeds from left to right during most of the core-helium-burning phase (solid lines). The data points correspond to the red-clump stars presented by Mosser et al. (2012). The magenta line shows a model where we assumed strong penetrative convection.
Current usage metrics show cumulative count of Article Views (full-text article views including HTML views, PDF and ePub downloads, according to the available data) and Abstracts Views on Vision4Press platform.
Data correspond to usage on the plateform after 2015. The current usage metrics is available 48-96 hours after online publication and is updated daily on week days.
Initial download of the metrics may take a while.