Fig. 7.
Download original image
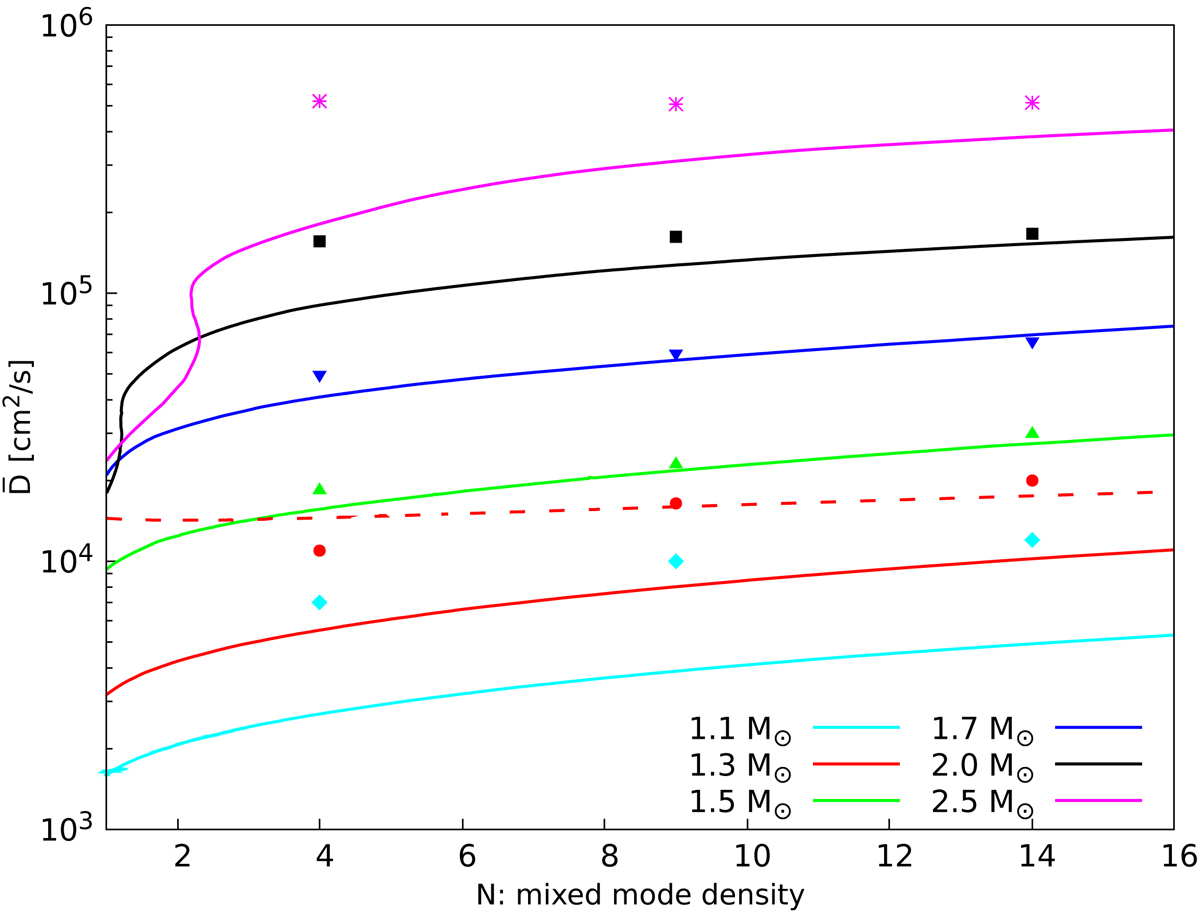
Time-averaged diffusion coefficient as a function of the mixed mode density for different masses computed with Eq. (3) using α = 2 and D0 = 50 cm2 s−1. The points correspond to the additional viscosities estimated by Moyano et al. (2022) to reproduce the core-rotation rate of RGB stars at different mixed-mode densities. The red dashed line corresponds to a model where a constant value of D = 2 × 104 cm2 s−1 was used until log g ≃ 3.9.
Current usage metrics show cumulative count of Article Views (full-text article views including HTML views, PDF and ePub downloads, according to the available data) and Abstracts Views on Vision4Press platform.
Data correspond to usage on the plateform after 2015. The current usage metrics is available 48-96 hours after online publication and is updated daily on week days.
Initial download of the metrics may take a while.