Fig. 5.
Download original image
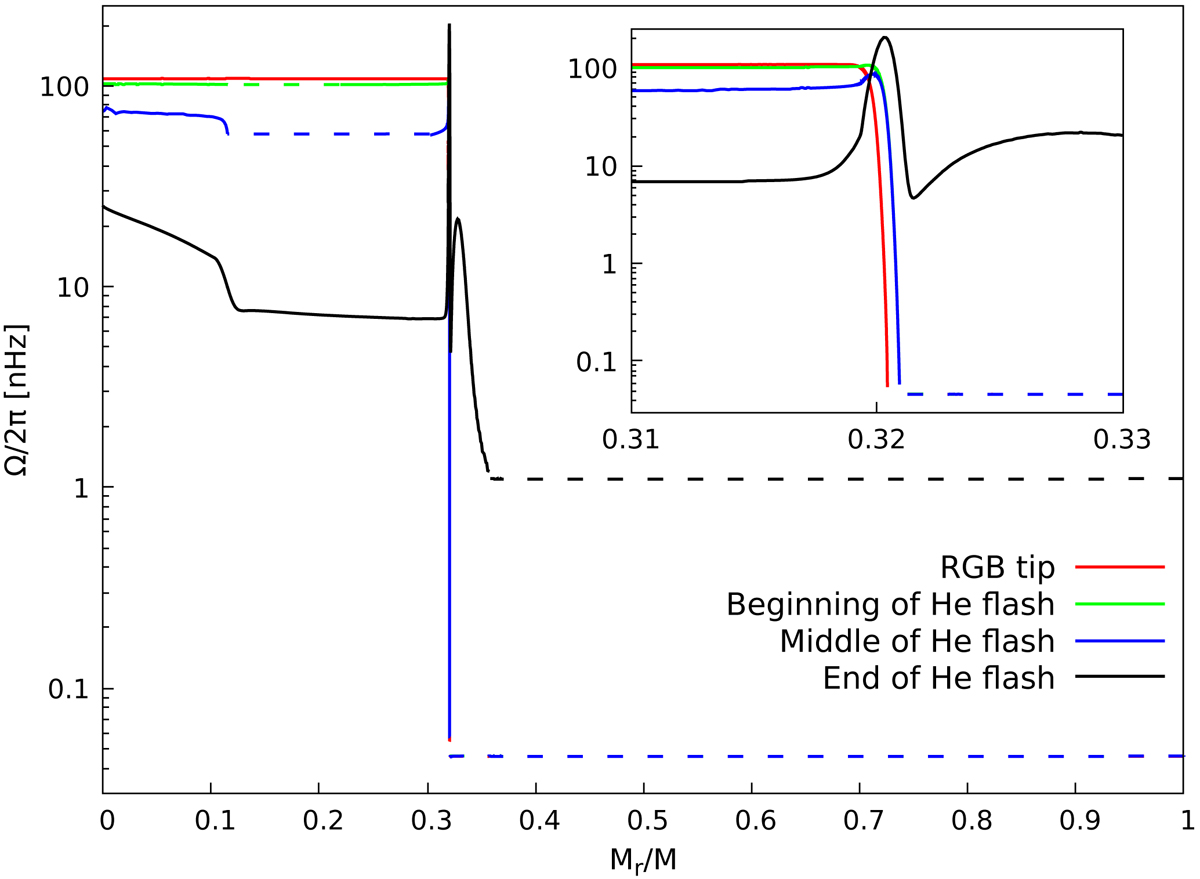
Angular velocity as a function of mass coordinate at different moments during the first helium flash of the 1.5 M⊙ model presented in Fig. 4. Radiative regions are shown as solid lines, while convective regions are shown as dotted lines. The inset around Mr/M ∼ 0.32 shows a zoomed-in image of the location of the H-burning shell.
Current usage metrics show cumulative count of Article Views (full-text article views including HTML views, PDF and ePub downloads, according to the available data) and Abstracts Views on Vision4Press platform.
Data correspond to usage on the plateform after 2015. The current usage metrics is available 48-96 hours after online publication and is updated daily on week days.
Initial download of the metrics may take a while.