Fig. 4.
Download original image
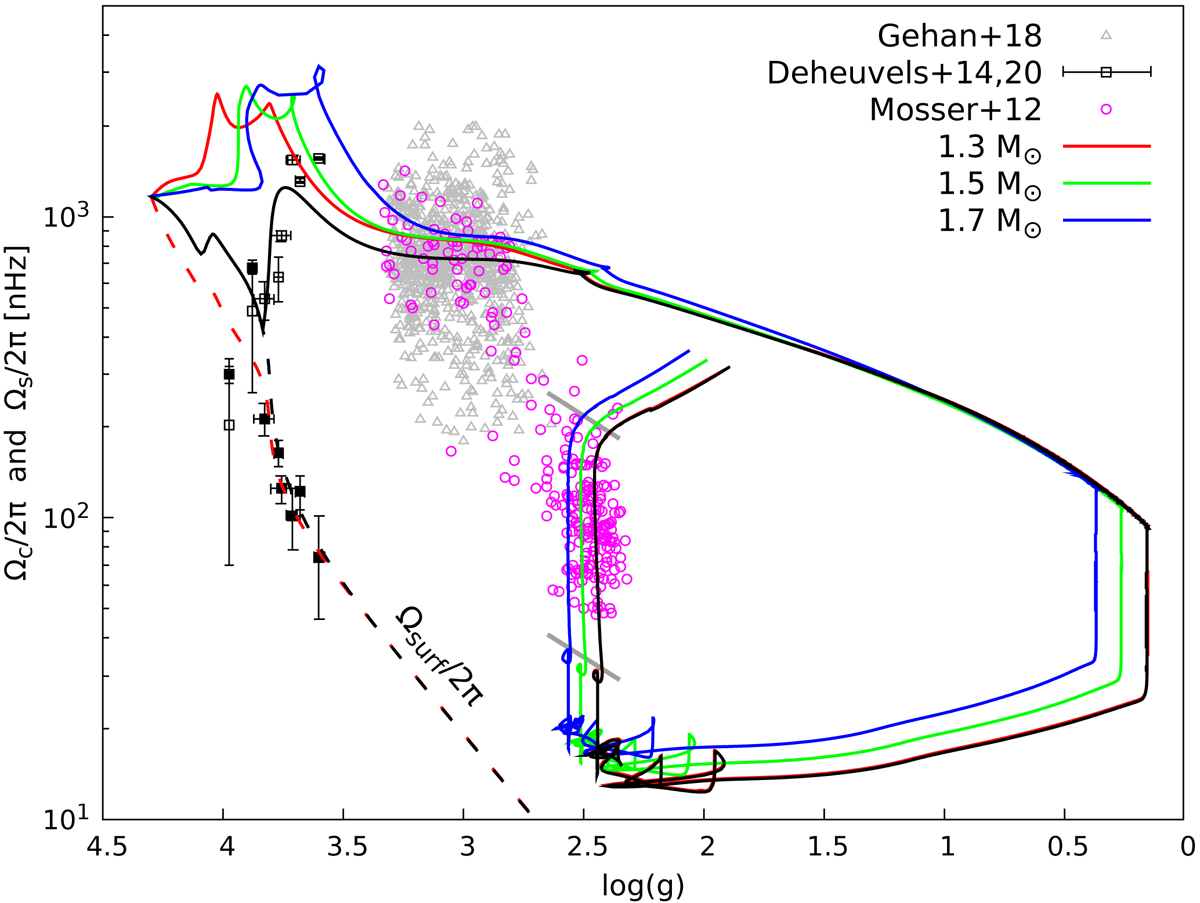
Evolution of the core rotation rate for models with an additional diffusion coefficient of the form Dadd = D0(Ωcore/Ωsurf)2, with D0 = 50 cm2 s−1. The black filled (empty) symbols show the surface (core) rotation rate of the eight subgiants presented by Deheuvels et al. (2014, 2020). The grey symbols show the core rotation rate of stars in the lower RGB (Gehan et al. 2018). The magenta circles correspond to red giants presented by Mosser et al. (2012) with those grouped around log g ∼ 2.5 in the core-helium-burning phase (only those with an estimated mass M ≲ 2 M⊙ are shown). The red and black dashed lines show the surface rotation rate of the 1.3 M⊙ model. The black line shows a 1.3 M⊙ model, for which we enforced rigid rotation until the location of the second subgiant at log g ∼ 3.9. The grey lines at log g ∼ 2.5 show the region where the central abundance of helium is in the range Y = 0.9 − 0.1 (i.e. the long and stable core-helium-burning phase).
Current usage metrics show cumulative count of Article Views (full-text article views including HTML views, PDF and ePub downloads, according to the available data) and Abstracts Views on Vision4Press platform.
Data correspond to usage on the plateform after 2015. The current usage metrics is available 48-96 hours after online publication and is updated daily on week days.
Initial download of the metrics may take a while.