Fig. 9.
Download original image
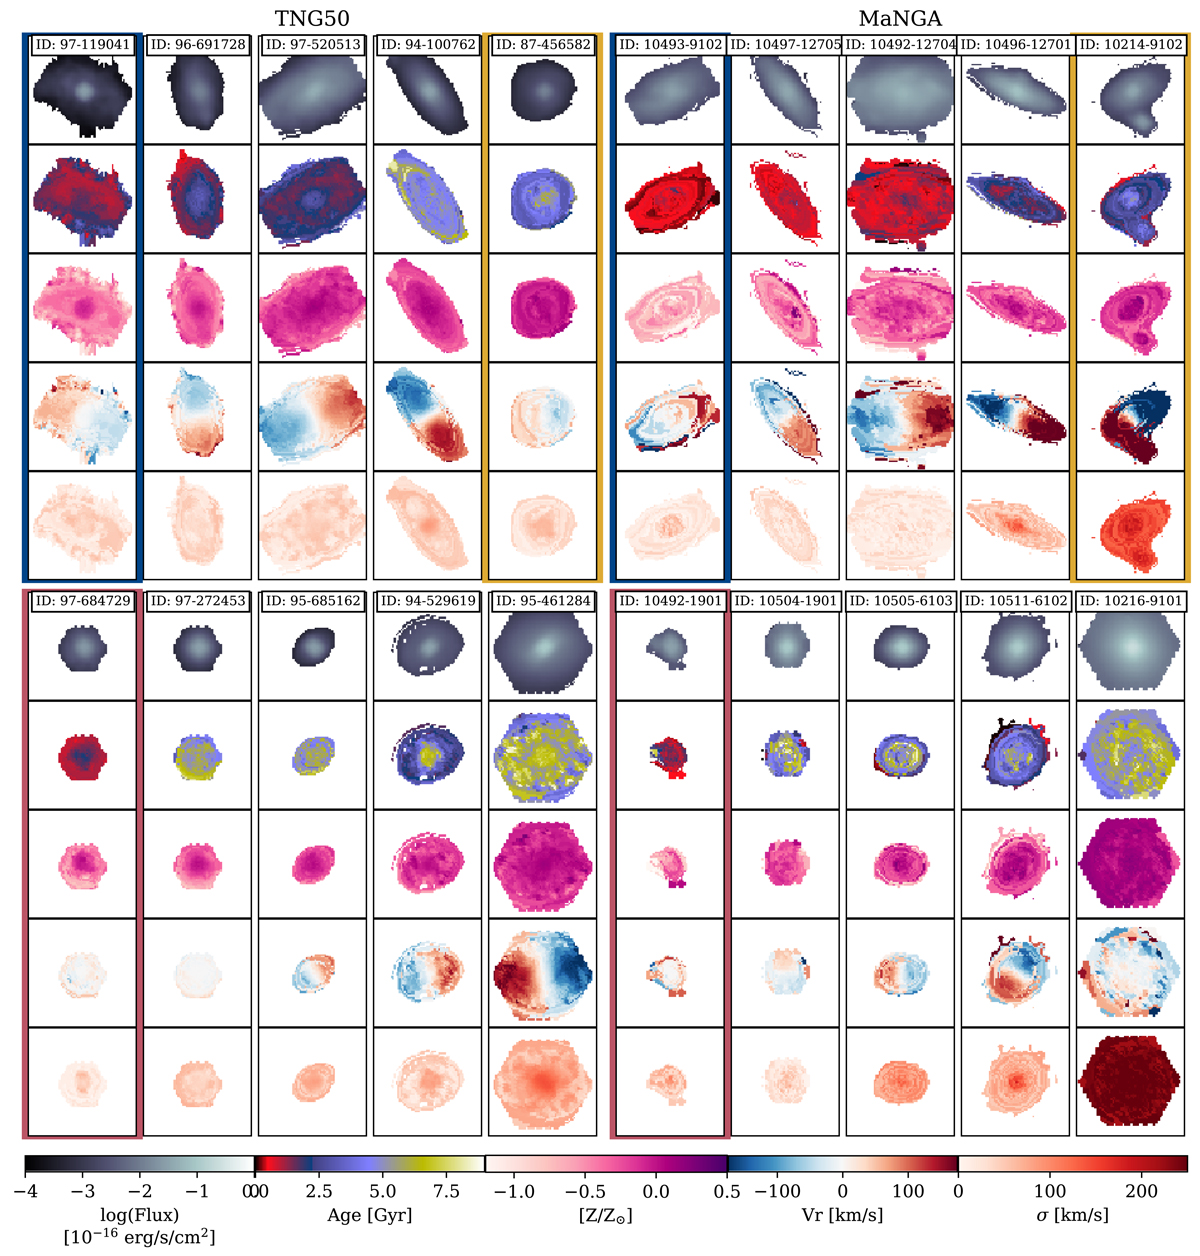
Simulated and observed recovered maps. The left panels show ten TNG50 recovered stellar population and kinematic maps. From top to bottom in each subpanel: the V-band reconstructed image, LW-age, LW-metallicity, LOS velocity, and velocity dispersion maps. The right panels show the MaNGA counterparts of each of the galaxies in the left panels. These examples were chosen to represent ten regions of the M* − Re: five mass bins (delimited by 109.25, 109.75, 1010.25, and 1010.75 M⊙), which correspond to the columns, with increasing mass from left to right, and two Re[kpc] regions per mass bin (rows, increasing size from bottom to top).
Current usage metrics show cumulative count of Article Views (full-text article views including HTML views, PDF and ePub downloads, according to the available data) and Abstracts Views on Vision4Press platform.
Data correspond to usage on the plateform after 2015. The current usage metrics is available 48-96 hours after online publication and is updated daily on week days.
Initial download of the metrics may take a while.