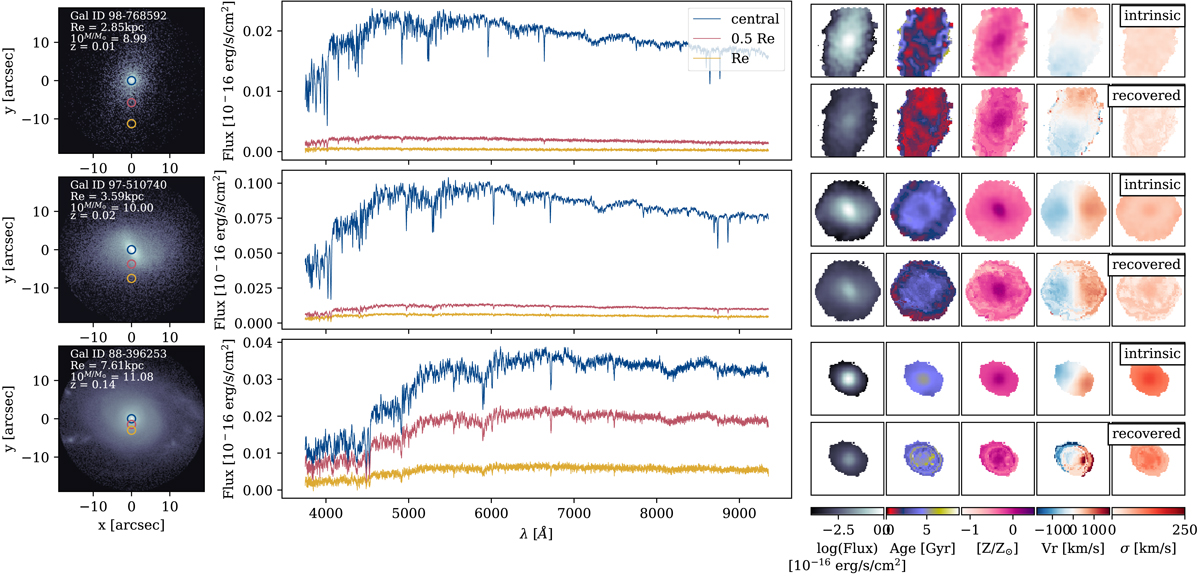
Fig. 5.
Download original image
Three simulated galaxies with stellar masses 109 M⊙, 1010 M⊙, and 1011 M⊙ show the mocking process. Panels on the left-hand side show the stellar mass density of the galaxies, while the central panels show their spectra at different radii (centre in blue, 0.5Re in red, and 1Re in yellow). Squared panels on the right-hand side show the stellar properties derived directly from the particles (top row for each galaxy) and recovered from the spectral cubes with PYPIPE3D (bottom row for each galaxy). From left to right, these panels show the V-band reconstructed image (mass density for the particle maps), luminosity-weighted age, luminosity-weighted metallicity, LsOS velocity, and velocity dispersion. As galaxy mass increases, the spectra are redder. Stellar maps are, in general, properly recovered.
Current usage metrics show cumulative count of Article Views (full-text article views including HTML views, PDF and ePub downloads, according to the available data) and Abstracts Views on Vision4Press platform.
Data correspond to usage on the plateform after 2015. The current usage metrics is available 48-96 hours after online publication and is updated daily on week days.
Initial download of the metrics may take a while.