Fig. 2.
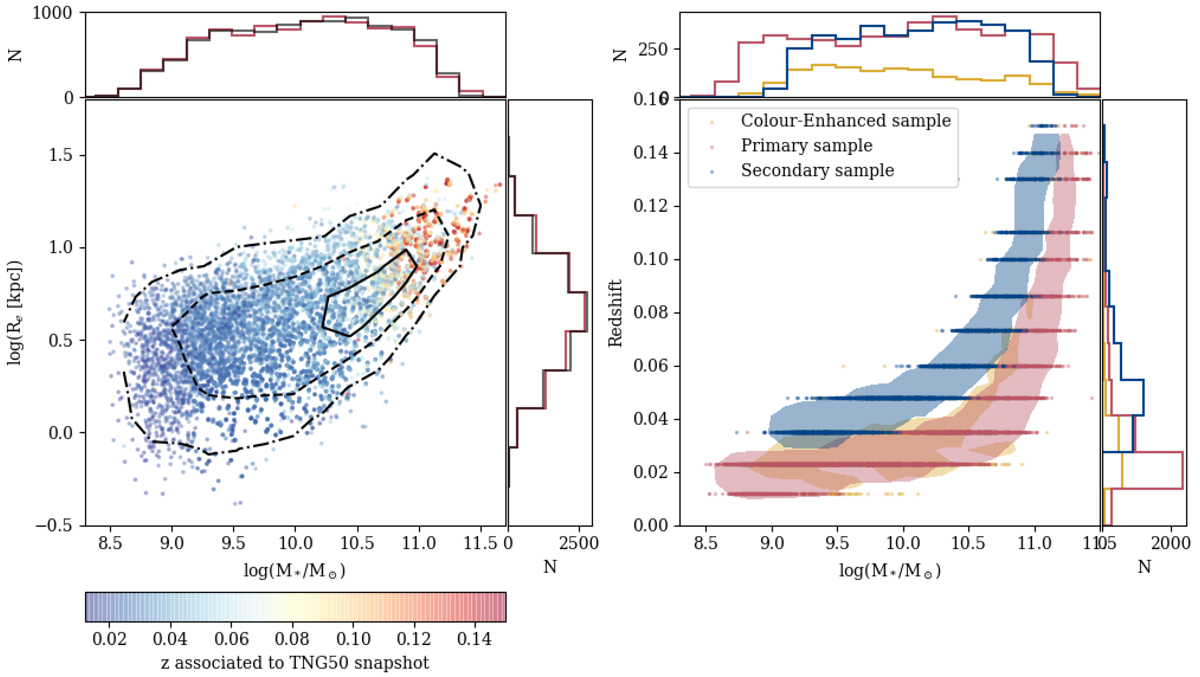
Download original image
Matched properties of the MaNGIA sample. Left panel: Distribution of mass and effective radius (M* − Re plane) of the TNG galaxies in the matched sample, colour-coded by redshift. The black contours indicate the density of galaxies in the MaNGA M* − Re plane. Right panel: Mass vs. redshift of the TNG galaxies in the matched sample. The colour-coding indicates the MaNGA subsamples: galaxies in the Primary sample in red, Secondary sample in blue, and Color-Enhanced sample in yellow. The contours show the distribution of the MaNGA galaxies in the plane.
Current usage metrics show cumulative count of Article Views (full-text article views including HTML views, PDF and ePub downloads, according to the available data) and Abstracts Views on Vision4Press platform.
Data correspond to usage on the plateform after 2015. The current usage metrics is available 48-96 hours after online publication and is updated daily on week days.
Initial download of the metrics may take a while.