Open Access
Fig. 9
Download original image
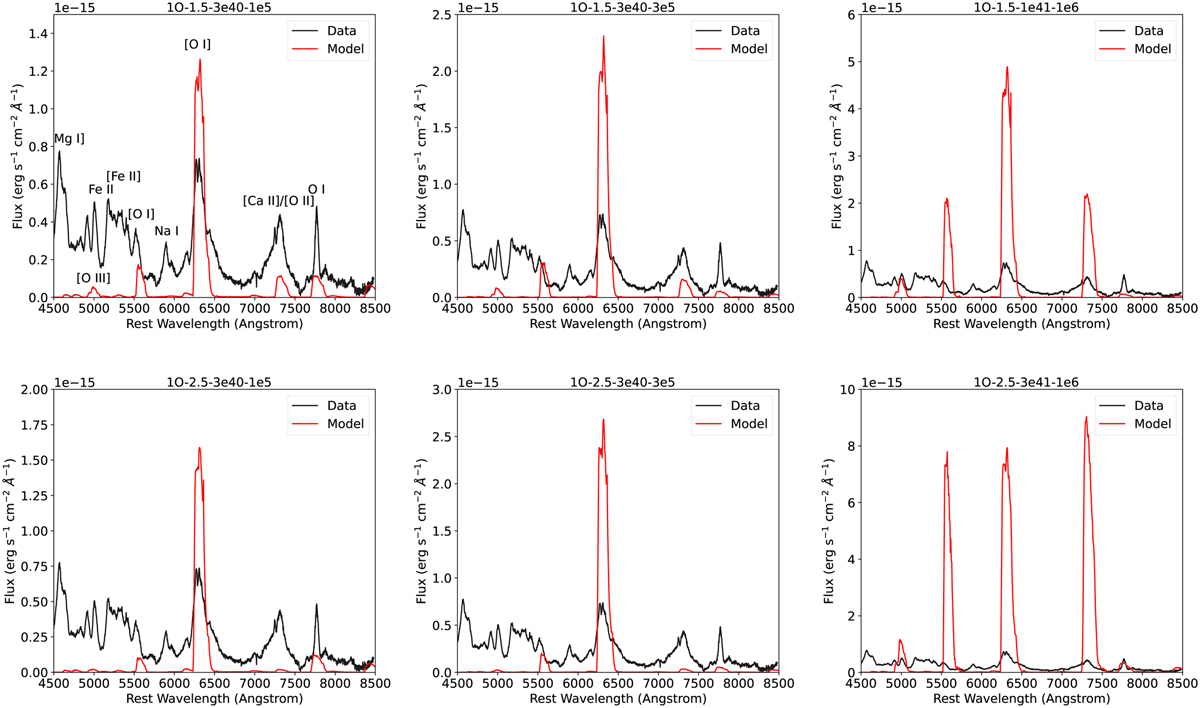
Two best-fitting dust-corrected model spectra to SN 2012au for each value of TPWN at one year for a pure oxygen composition compared to the observed spectrum from Milisavljevic et al. (2013). Strong lines and features are labeled in the upper left plot.
Current usage metrics show cumulative count of Article Views (full-text article views including HTML views, PDF and ePub downloads, according to the available data) and Abstracts Views on Vision4Press platform.
Data correspond to usage on the plateform after 2015. The current usage metrics is available 48-96 hours after online publication and is updated daily on week days.
Initial download of the metrics may take a while.