Fig. 7
Download original image
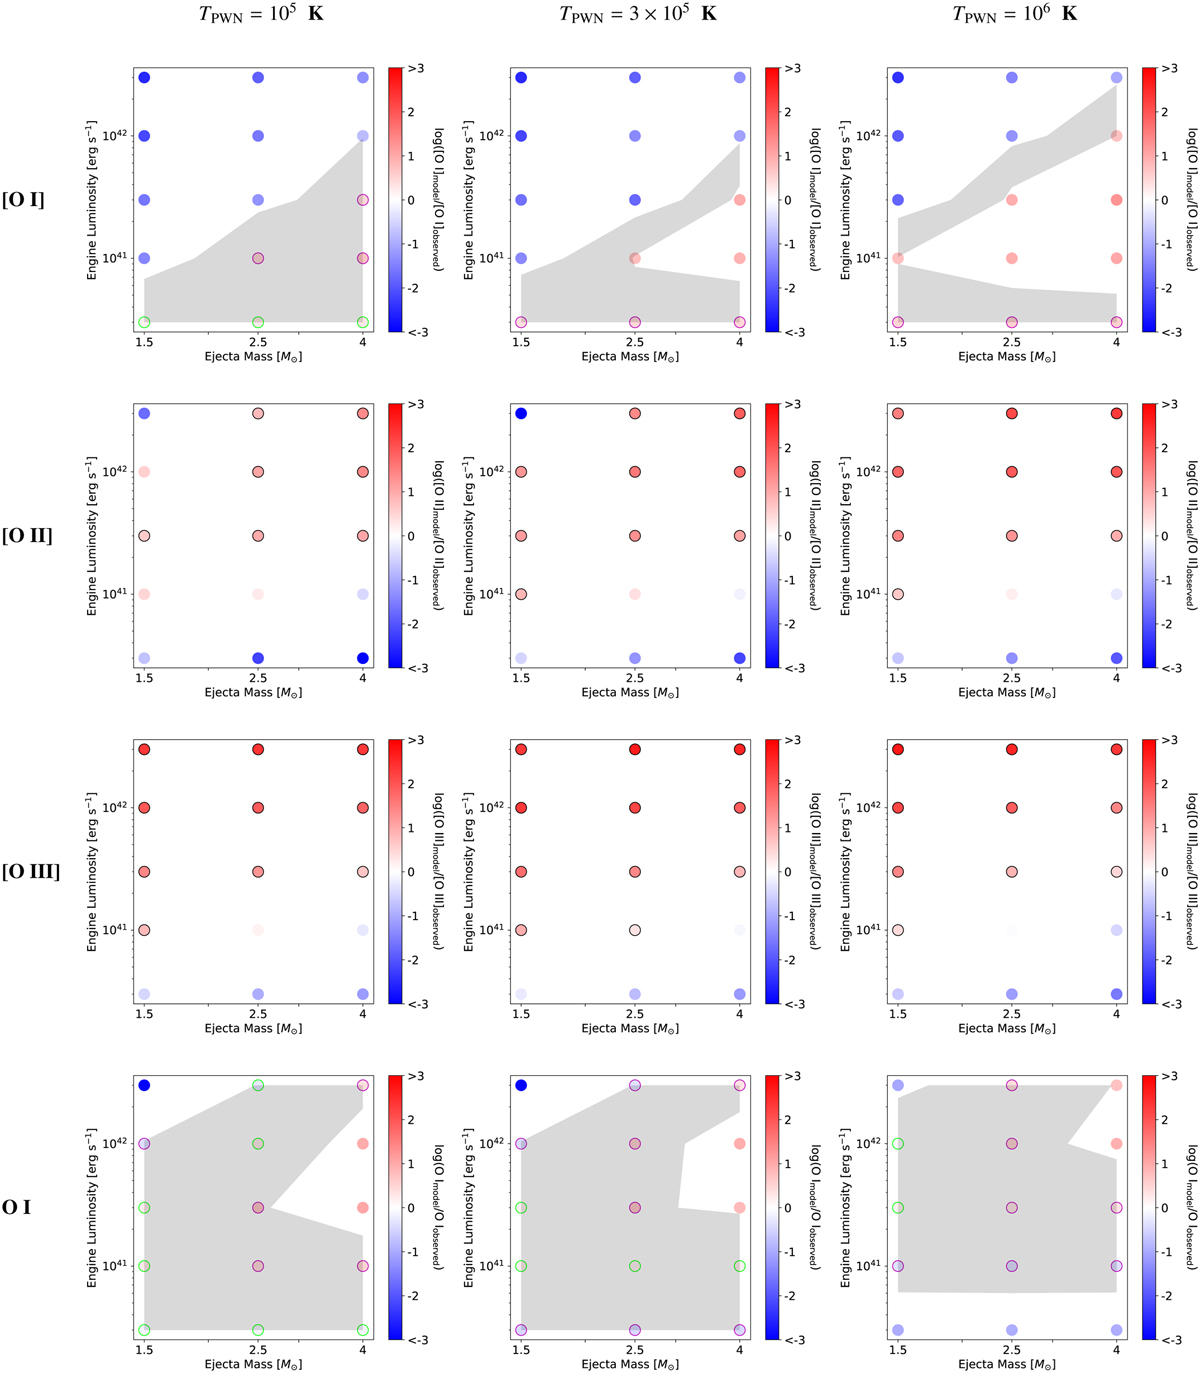
Luminosity of the model [O I] (top), [O II] (second row), [O III] (third row), and O I (bottom) lines in units of the observed line luminosities and limits for SN 2012au at one year for a pure oxygen composition at three different values of TPWN. The green circled points represent where the model and observed values are within a factor of 2, the purple circles within a factor of 5, and the gray shaded region also within a factor of 5. The black circled points (for [O II] and [O III]) represent where the model luminosity is more than a factor of two higher than the observational limit.
Current usage metrics show cumulative count of Article Views (full-text article views including HTML views, PDF and ePub downloads, according to the available data) and Abstracts Views on Vision4Press platform.
Data correspond to usage on the plateform after 2015. The current usage metrics is available 48-96 hours after online publication and is updated daily on week days.
Initial download of the metrics may take a while.