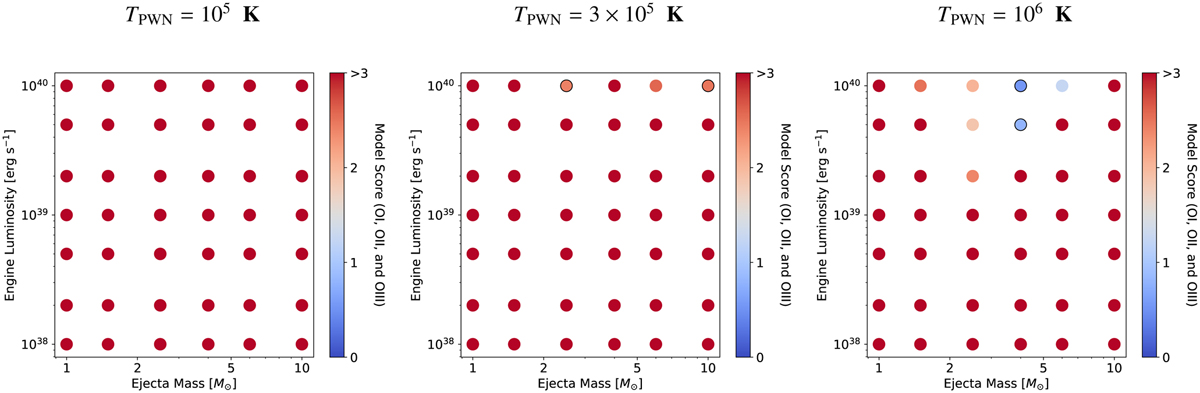
Fig. 12
Download original image
Goodness-of-fit score for each model in the realistic composition at six years based on the [O I], [O II], and [O III] lines. Lower scores indicate a better fit to the data (from Eq. (12), a perfect fit has a score of 0, all three lines off by a factor of two has a score of 0.27, and all three lines off by a factor of ten has a score of 3). The black circles indicate the two models with the lowest scores for each TPWN, although TPWN = 105 K has no models with scores <3, and TPWN = 3 × 10⁵ K has no models with scores <2. The best-fitting models for TPWN = 106 K are plotted in Fig. 13
Current usage metrics show cumulative count of Article Views (full-text article views including HTML views, PDF and ePub downloads, according to the available data) and Abstracts Views on Vision4Press platform.
Data correspond to usage on the plateform after 2015. The current usage metrics is available 48-96 hours after online publication and is updated daily on week days.
Initial download of the metrics may take a while.