Fig. 1
Download original image
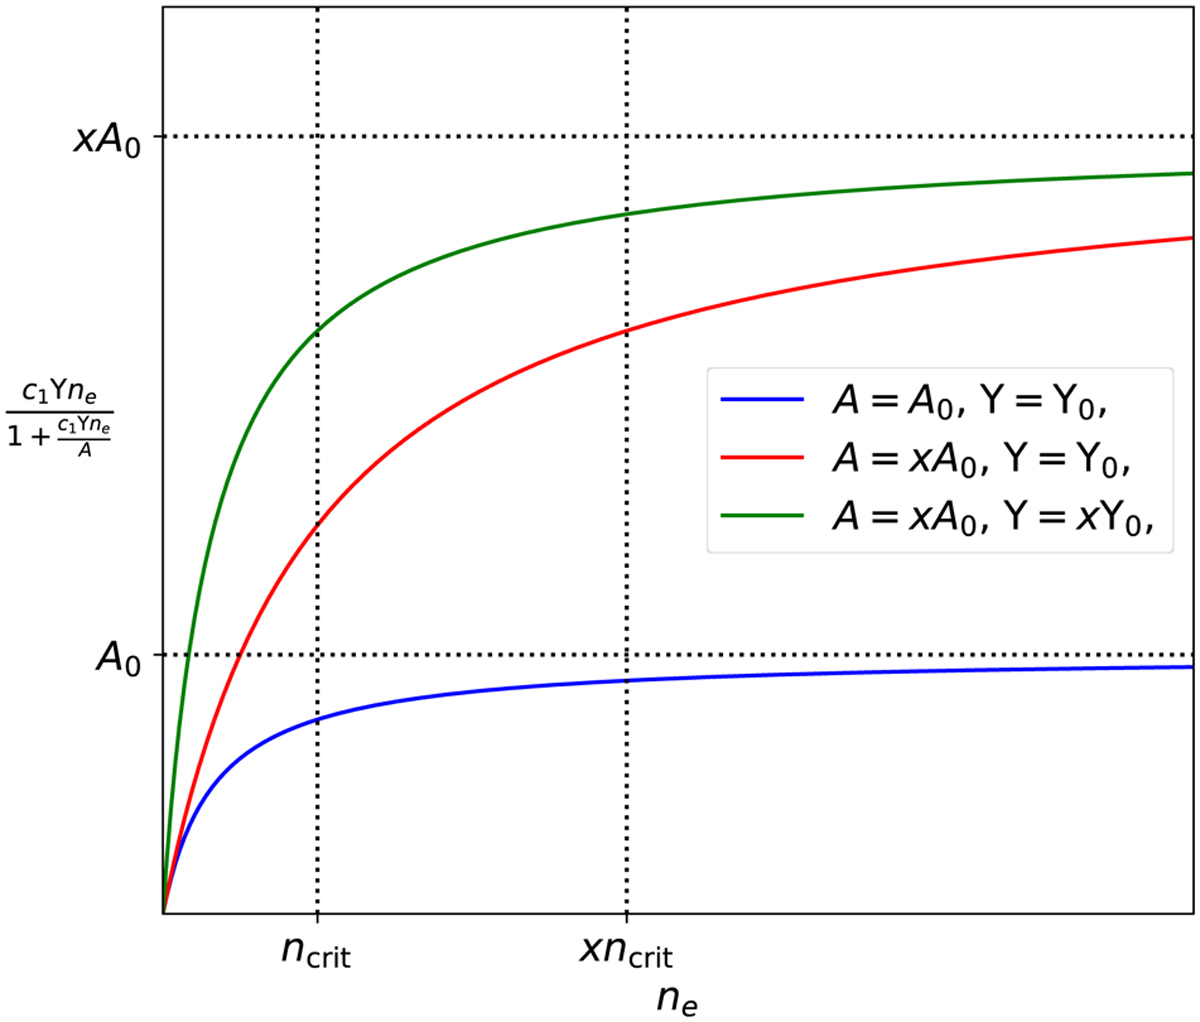
Schematic showing the dependence of the third line-luminosity factor on ne, A, and ϒ. Lines with the same A values (red and green) will approach the same luminosity in the high ne (LTE) limit, lines with the same ϒ values (blue and red) show the same luminosity in the low ne limit, and lines with the same A/ϒ (blue and green) show the same value of ncrit, while ncrit for the red line is a factor of x larger.
Current usage metrics show cumulative count of Article Views (full-text article views including HTML views, PDF and ePub downloads, according to the available data) and Abstracts Views on Vision4Press platform.
Data correspond to usage on the plateform after 2015. The current usage metrics is available 48-96 hours after online publication and is updated daily on week days.
Initial download of the metrics may take a while.