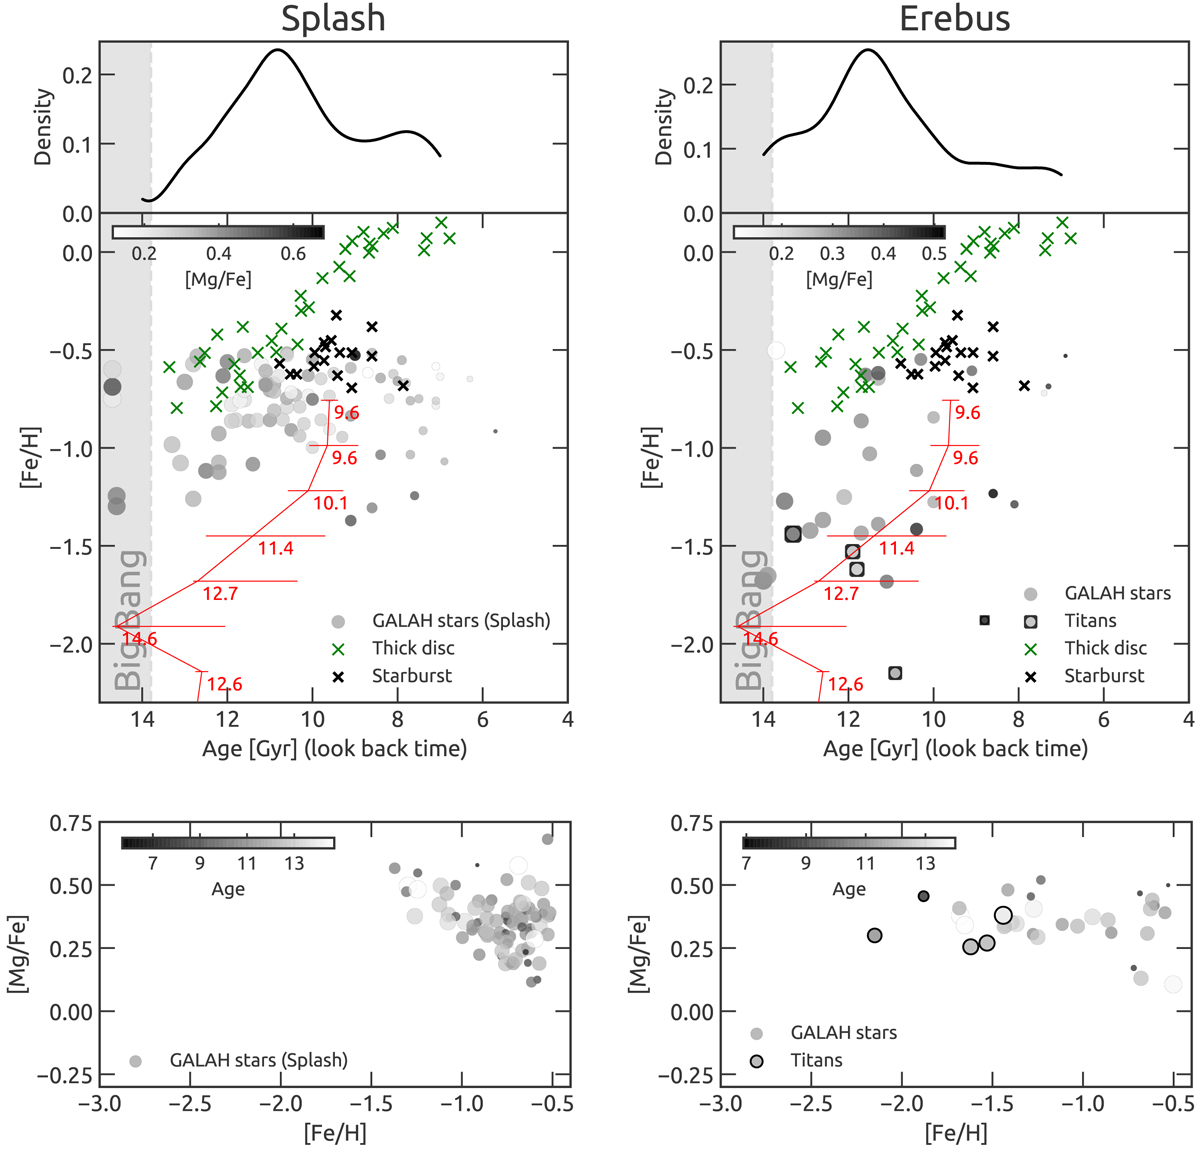
Fig. 8.
Download original image
Chemical evolution of the Splash and Erebus. Top: age–metallicity relation for stars in the Splash (left) and Erebus (right) components. The size of the points change according to stellar age and the color according to the [Mg/Fe] ratio. The Gaia-Enceladus sequence is shown as the red line. For the Splash, only stars with ages that have precision better than ±1.5 Gyr are considered. For Erebus, we plot those with age precision below ±2 Gyr. Thick and thin disc stars from Haywood et al. (2018) are shown as green and black crosses, respectively. Bottom: [Mg/Fe] ratio as a function of metallicity for stars in the Splash (left) and Erebus (right) components. Points are color- and size-coded according to the stellar age.
Current usage metrics show cumulative count of Article Views (full-text article views including HTML views, PDF and ePub downloads, according to the available data) and Abstracts Views on Vision4Press platform.
Data correspond to usage on the plateform after 2015. The current usage metrics is available 48-96 hours after online publication and is updated daily on week days.
Initial download of the metrics may take a while.