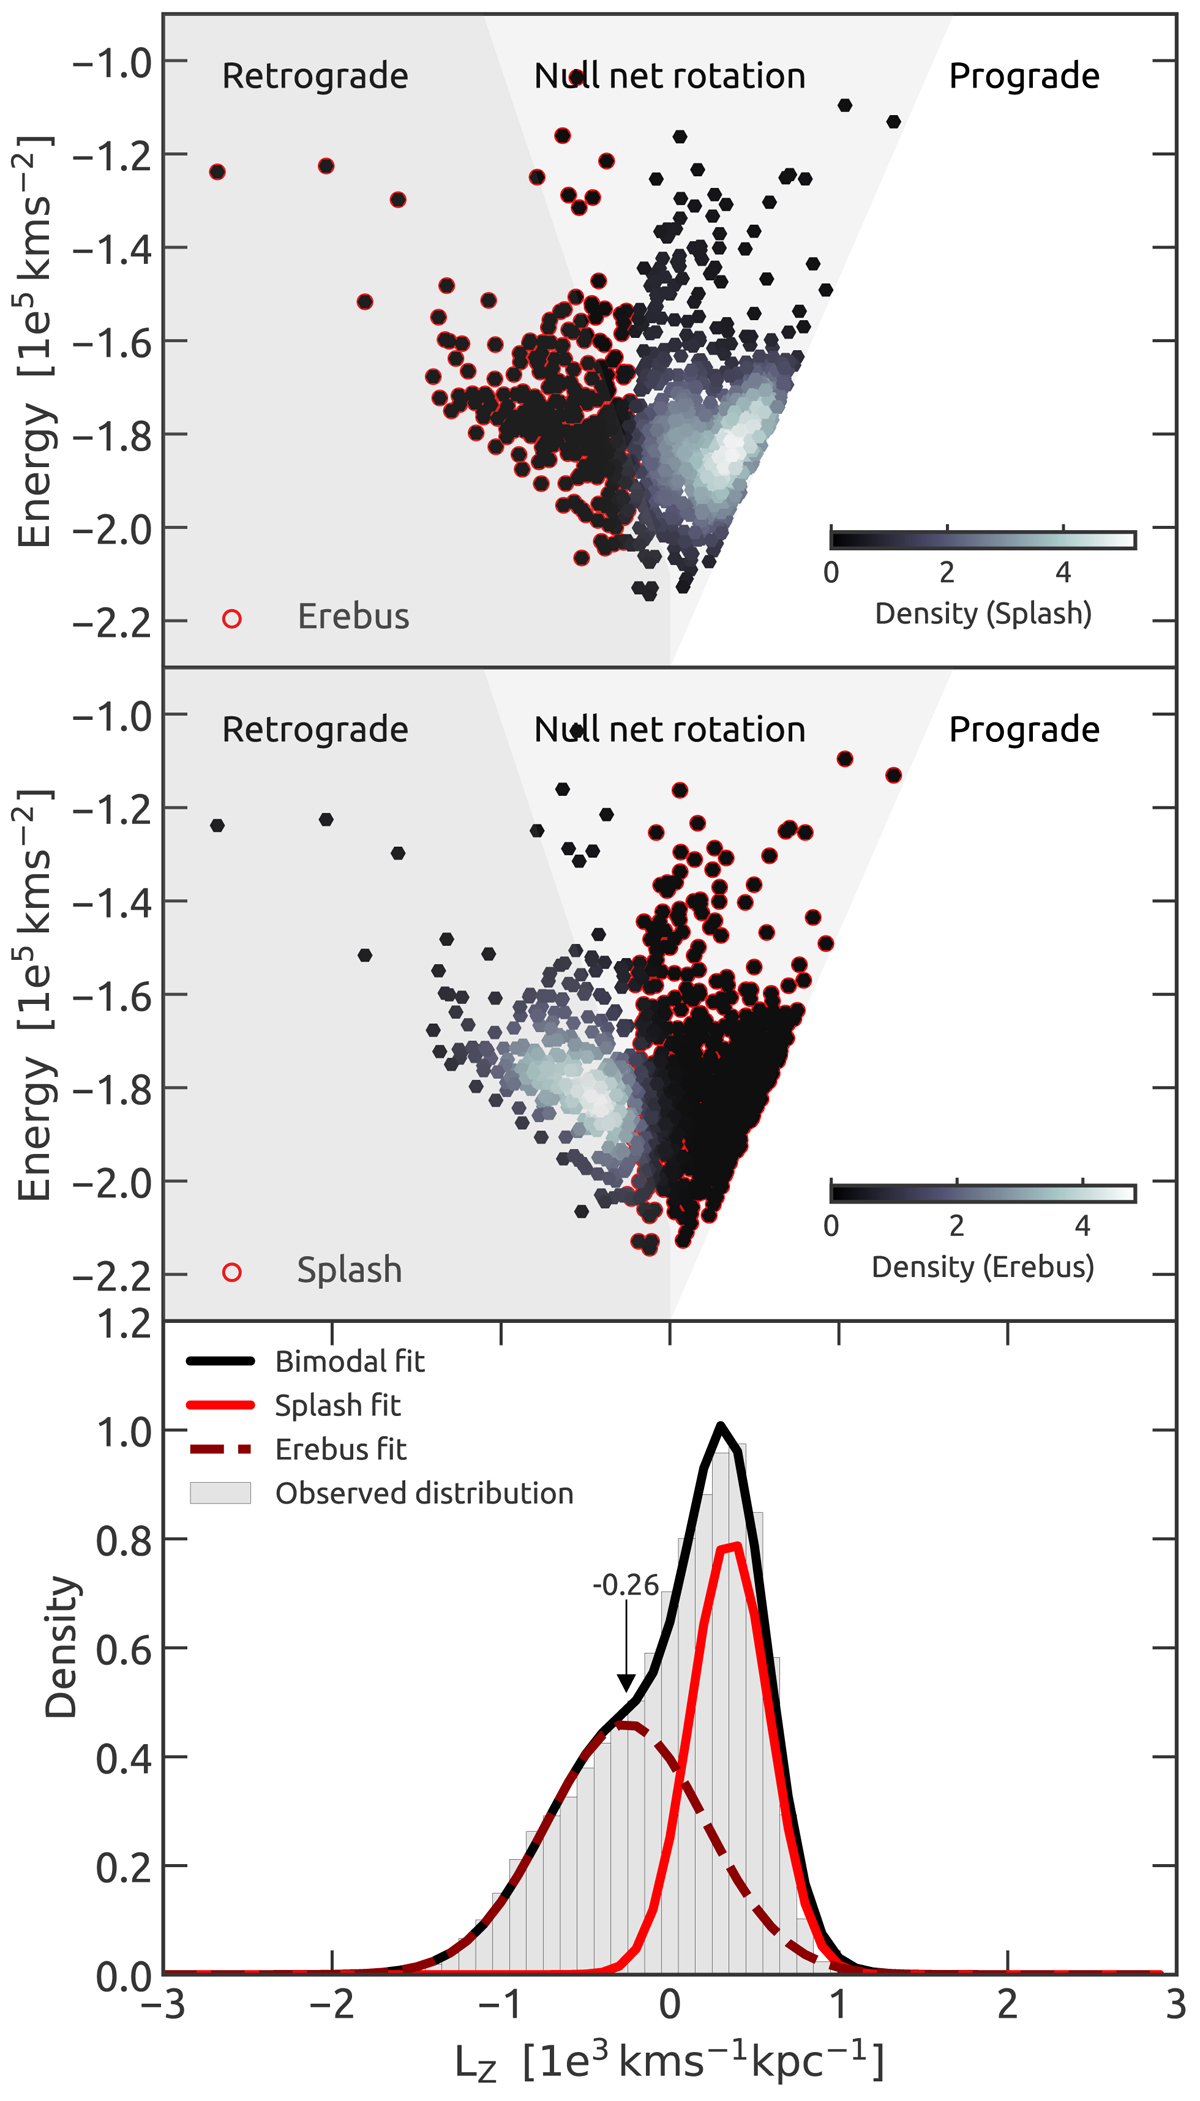
Fig. 5.
Download original image
Lindblad diagram of the Splash and Erebus populations. Top and middle panels highlight the probability density of the Splash and Erebus stars, respectively. Bottom panel shows the histogram of angular momentum, LZ, for stars with binding energy between −1.7 and −1.9 × 10⁵ km−2, approximately where most stars are concentrated. The histogram is well fit by a bi-modal Gaussian distribution (in black). One peak is dominated by Splash stars (solid bright red line) and the other by Erebus (dashed dark red line).
Current usage metrics show cumulative count of Article Views (full-text article views including HTML views, PDF and ePub downloads, according to the available data) and Abstracts Views on Vision4Press platform.
Data correspond to usage on the plateform after 2015. The current usage metrics is available 48-96 hours after online publication and is updated daily on week days.
Initial download of the metrics may take a while.