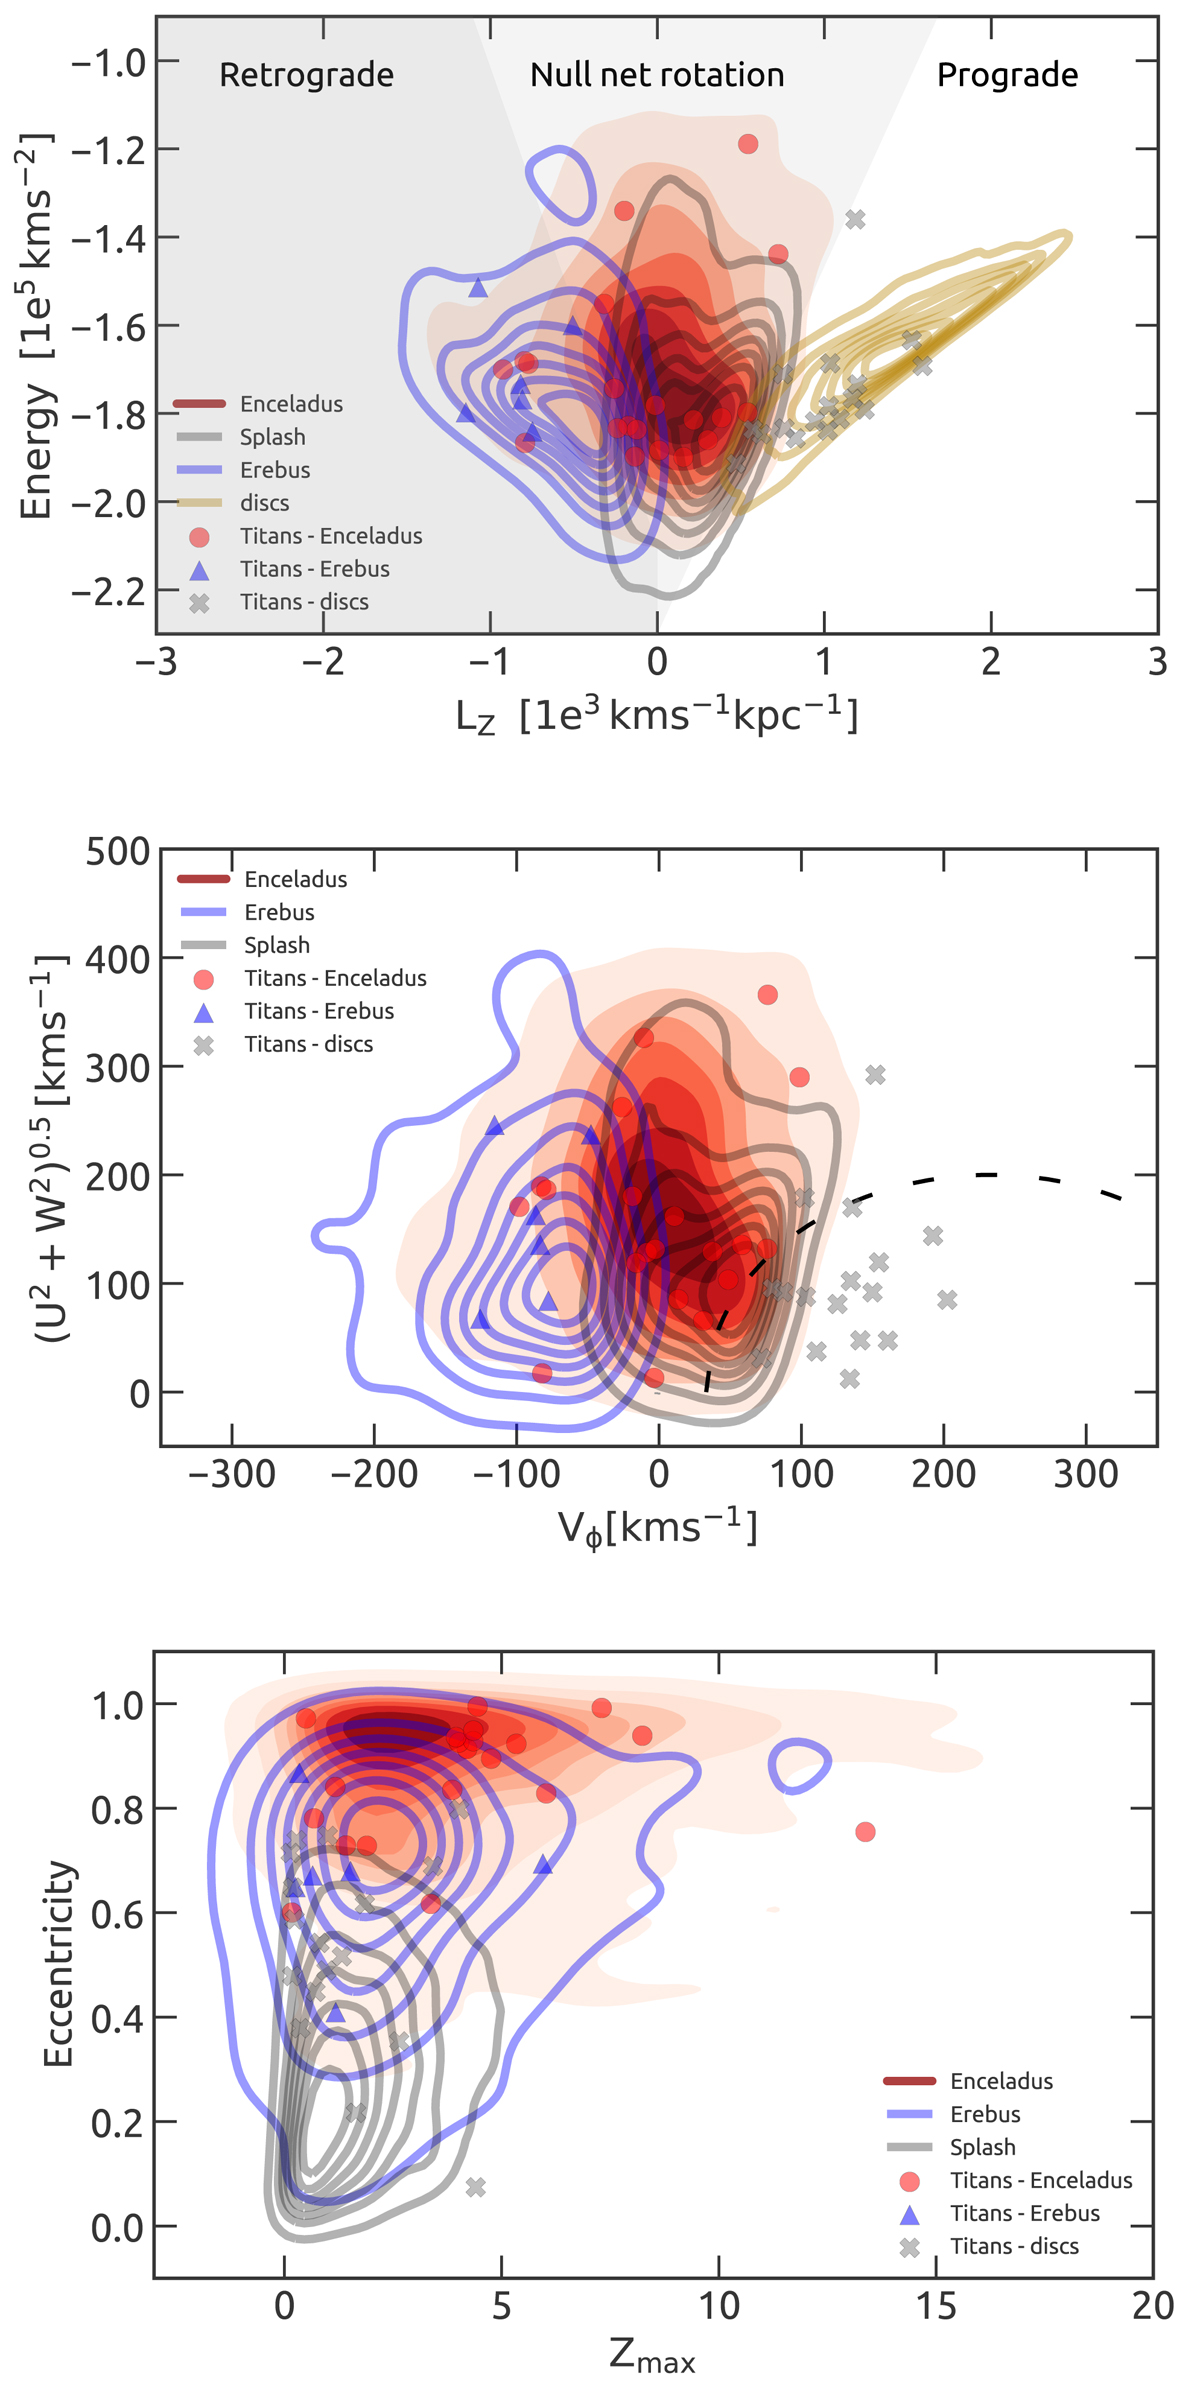
Fig. 4.
Download original image
Inner halo populations in kinematic and dynamical diagrams. Top panel: Lindblad diagram. The contours represent the 33, 66, 90, 95, 98, 99, and 99.9% cumulative distribution of the populations disentangled with the TITANS and GALAH metal-poor stars. The regions and stars corresponding to the Gaia-Enceladus, Splash, and Erebus populations are highlighted. Here, the TITANS that have disc dynamics are also shown for completeness. Mid panel: Toomre diagram. Symbols and colors are the same as in the top panel. The region of disc stars, selected following Helmi et al. (2018), is delimited by the dashed line. Bottom panel: eccentricity vs. maximum distance from the Galactic plane (Zmax). Symbols and colors are the same as in the other panels.
Current usage metrics show cumulative count of Article Views (full-text article views including HTML views, PDF and ePub downloads, according to the available data) and Abstracts Views on Vision4Press platform.
Data correspond to usage on the plateform after 2015. The current usage metrics is available 48-96 hours after online publication and is updated daily on week days.
Initial download of the metrics may take a while.