Fig. 4
Download original image
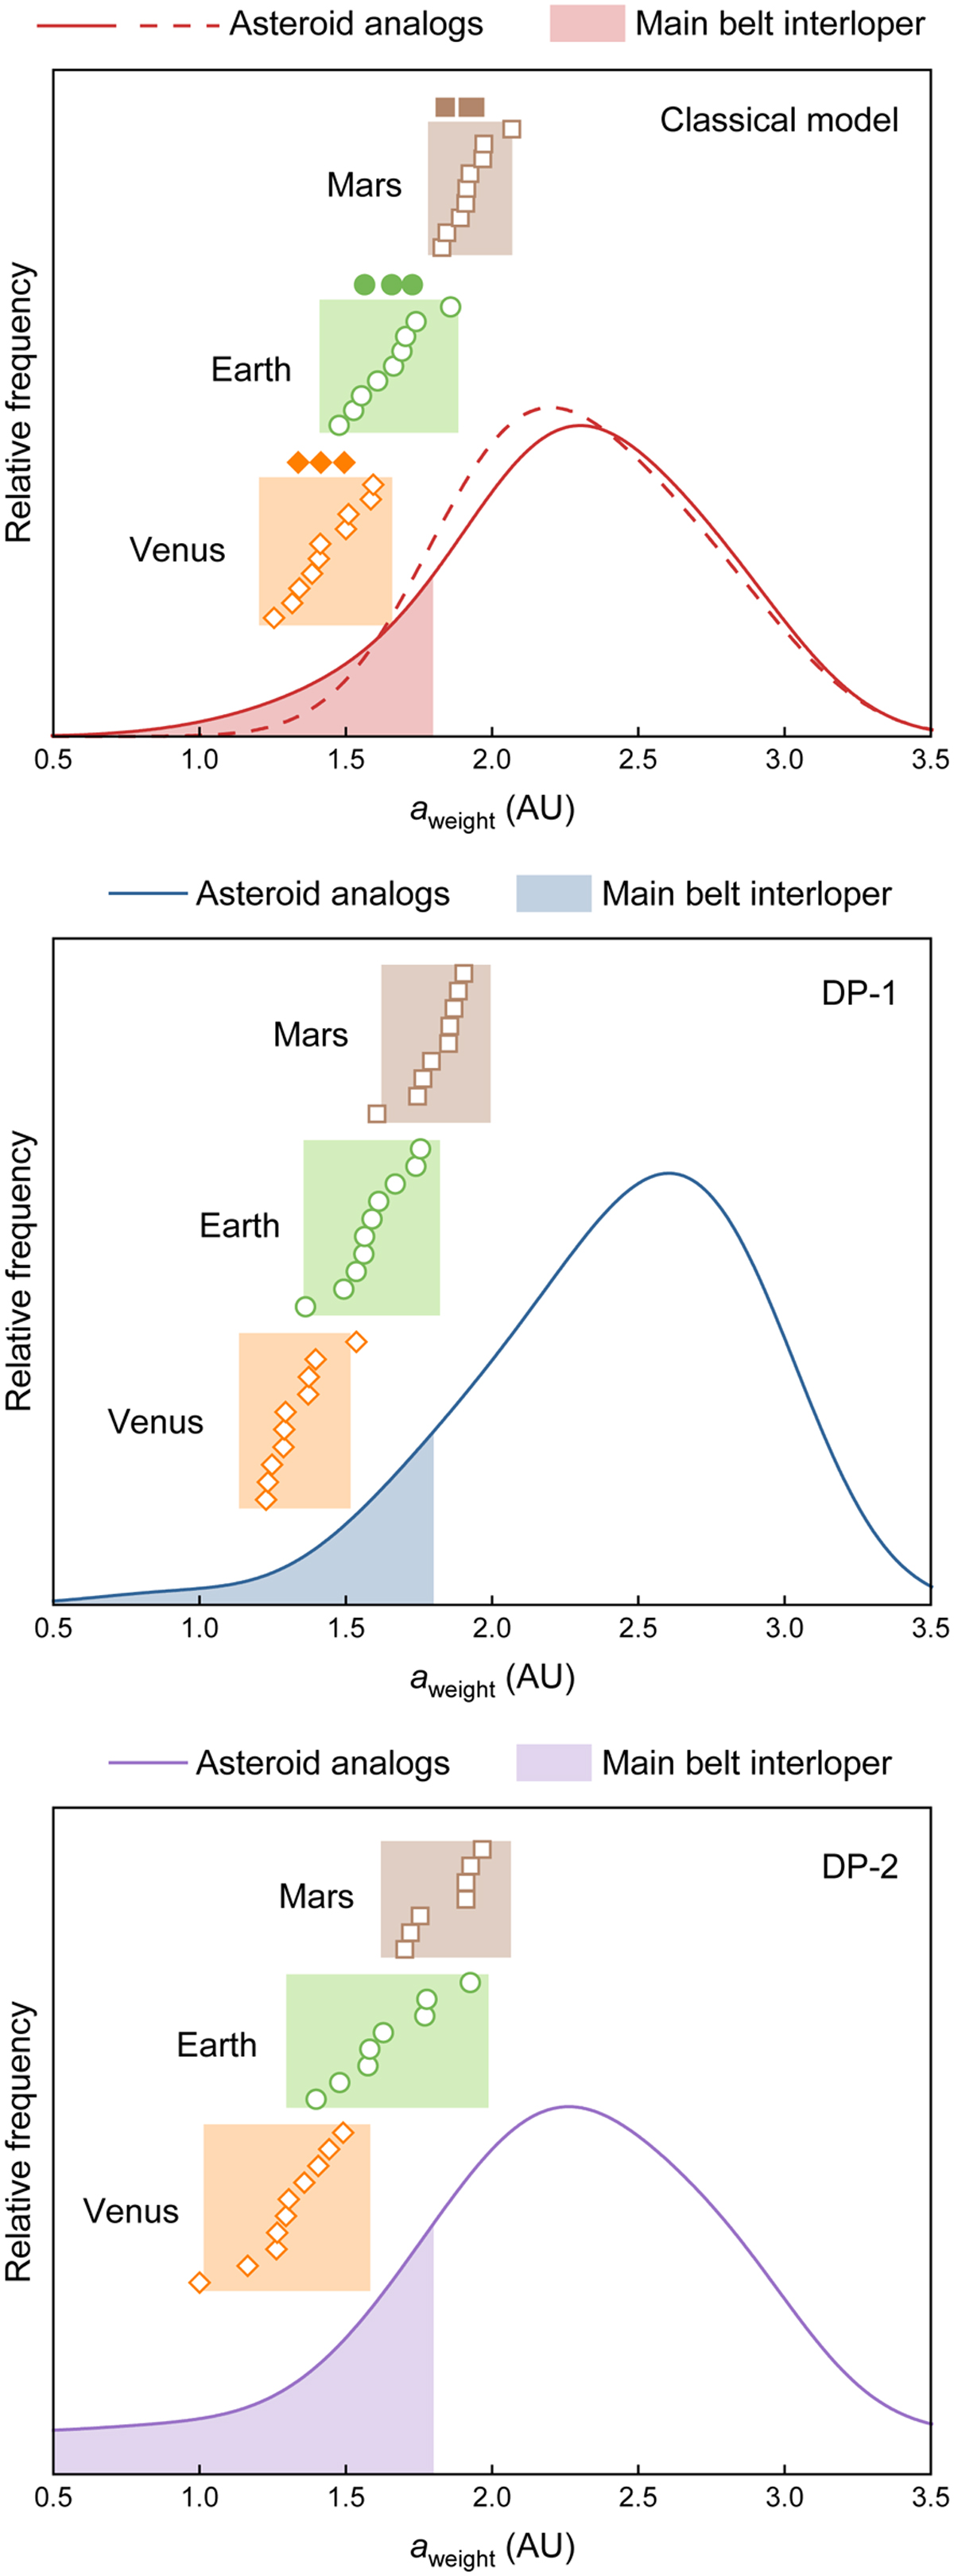
Average feeding zone locations of the analogs of the terrestrial planets and main-belt asteroids in the simulations. The open symbols are the aweight values of the terrestrial planet analogs. Tlie shaded bands represent 2σ of aweight for each terrestrial planet analog. The solid curves are the kernel density estimates of the aweight values of main-belt asteroid analogs. The shaded areas under the curves represent the portion of main-belt interlopers (aweight < 1.8AU) in the main-belt asteroid analogs. The filled symbols and the dashed curve are the aweight values of the terrestrial planet analogs and the kernel density estimate of Oweighi values of main-belt asteroid analogs in the high-resolution simulations, respectively.
Current usage metrics show cumulative count of Article Views (full-text article views including HTML views, PDF and ePub downloads, according to the available data) and Abstracts Views on Vision4Press platform.
Data correspond to usage on the plateform after 2015. The current usage metrics is available 48-96 hours after online publication and is updated daily on week days.
Initial download of the metrics may take a while.