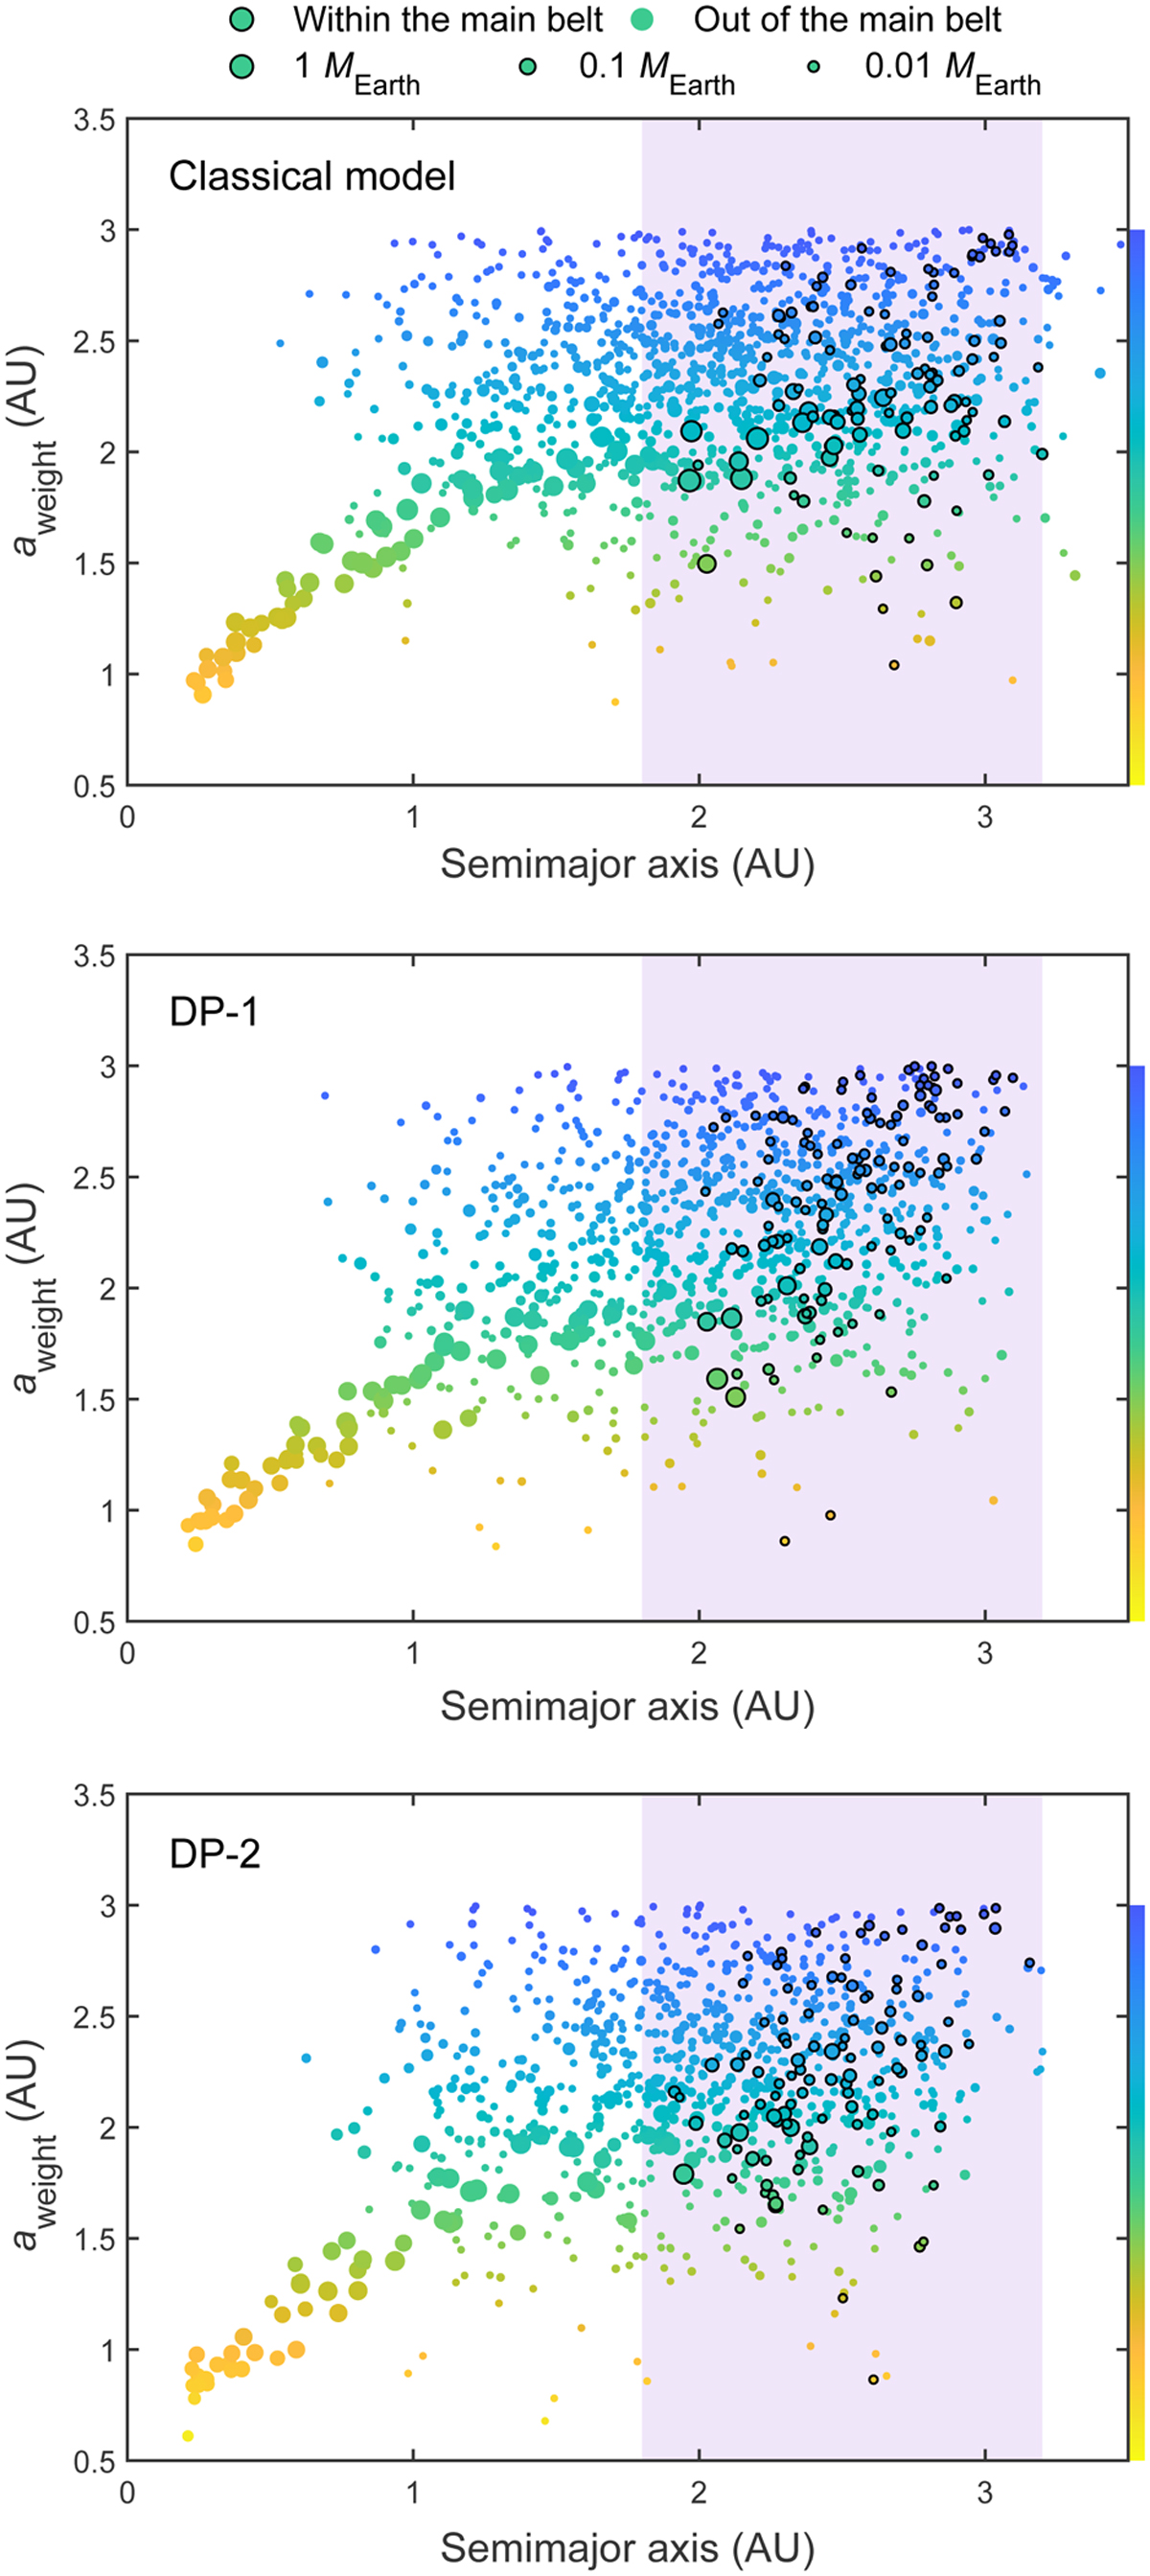
Fig. 3
Download original image
Comparison between the feeding zones and the final semimajor axes of bodies at the end of all simulations. All simulations for each model are included. The color coding represents the aweight (average location of feeding zone) of the bodies. The shaded region is the main belt region defined by perihelion distance q > 1.8 AU, eccentricity e < 0.3, inclination i < 25°, and semimajor axis a < 3.2 AU (Raymond & Izidoro 2017). Each body within the main belt region defined as an asteroid analog is represented by a filled circle with a black outline. The symbol size of each body is proportional to its radius but is not to scale on the x and y axes.
Current usage metrics show cumulative count of Article Views (full-text article views including HTML views, PDF and ePub downloads, according to the available data) and Abstracts Views on Vision4Press platform.
Data correspond to usage on the plateform after 2015. The current usage metrics is available 48-96 hours after online publication and is updated daily on week days.
Initial download of the metrics may take a while.