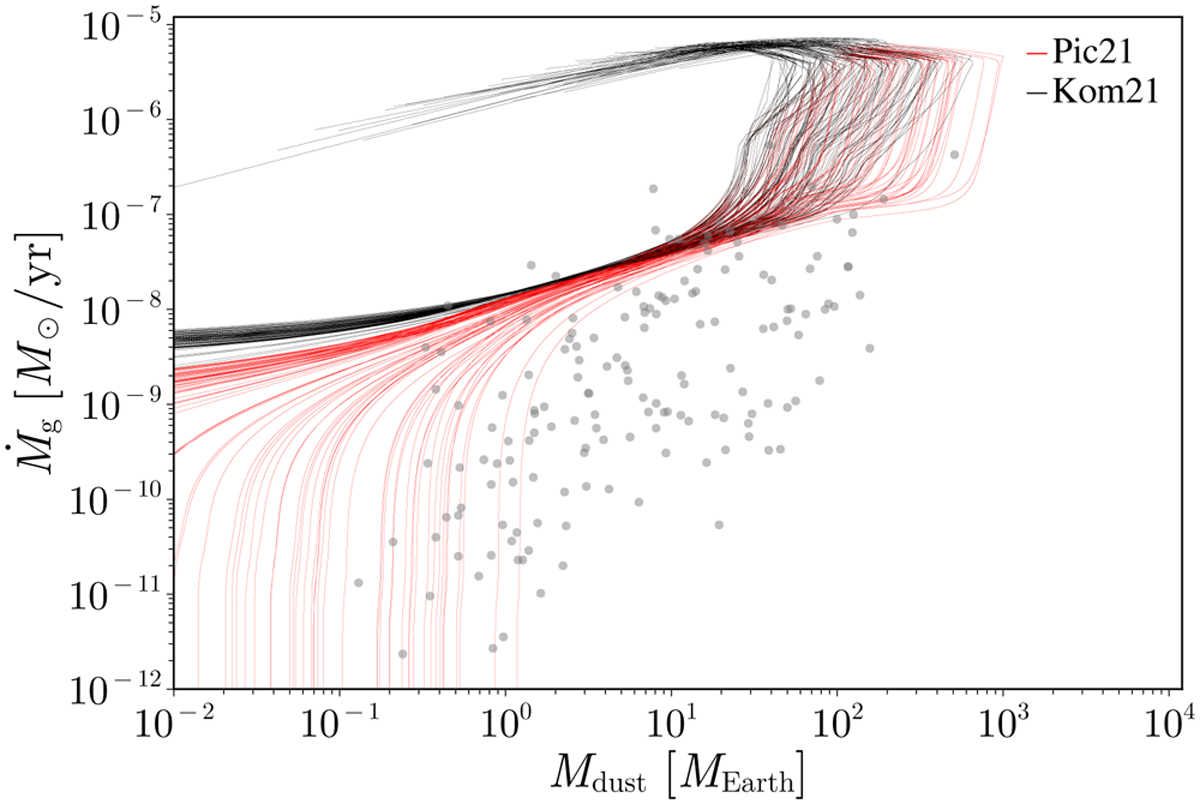
Fig. 7
Download original image
Gas accretion rate as a function of dust disc mass for the models using the Pic2l (black) and the Kom2l (red) photoevaporation prescriptions. The grey dots show the observational sample from Manara et al. (2022). Each line represents one disc’s evolutionary track. Discs start out at low dust masses and high gas accretion rates (~10−6 M⊙ yr−1). As they leave the formation phase, they pass through a phase where the gas accretion rate drops rapidly and the dust mass changes slowly. After this, the disc dust mass begins to quickly drain. If photoevaporation opens up a gap in the gas and clears the inner gas disc during this phase, the gas accretion rate drops rapidly and some dust is trapped. Otherwise, the gas accretion rate remains nearly unchanged while the dust drains.
Current usage metrics show cumulative count of Article Views (full-text article views including HTML views, PDF and ePub downloads, according to the available data) and Abstracts Views on Vision4Press platform.
Data correspond to usage on the plateform after 2015. The current usage metrics is available 48-96 hours after online publication and is updated daily on week days.
Initial download of the metrics may take a while.