Fig. 6
Download original image
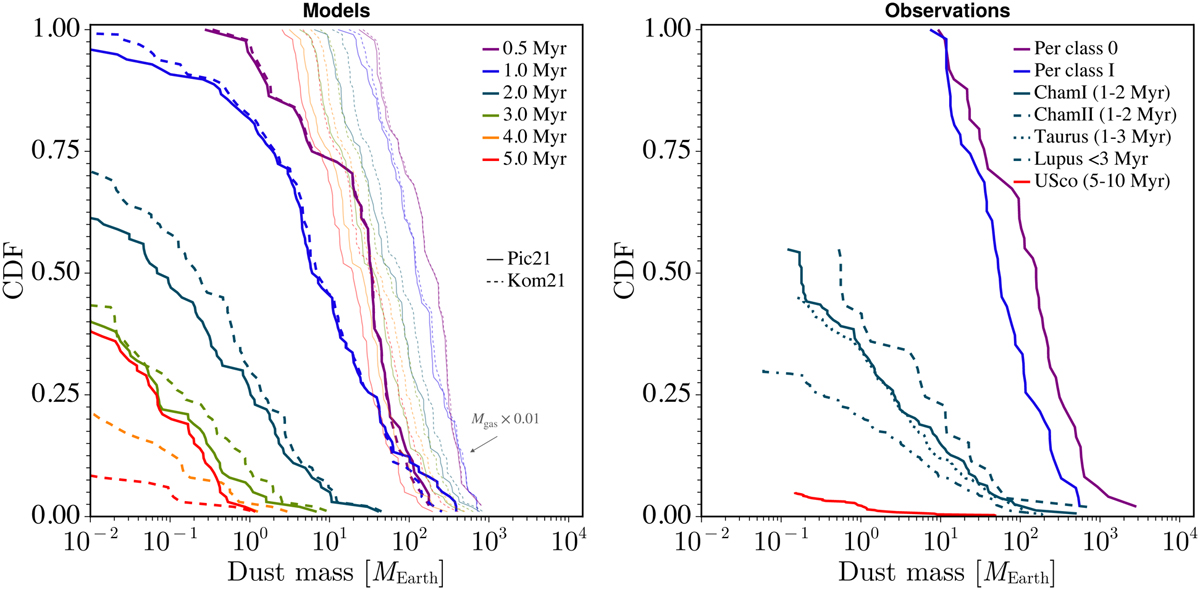
Cumulative disc dust mass distributions for the model (left plot) using using α = 10−2. Here we show the Pic2l (solid) and the Kom2l (dashed) photoevaporation prescriptions. A sample of observed disc masses are shown in the right plot. The two photoevaporation prescriptions are very similar at 0.5 and 1 Myr and begin to differ at the low-mass end at 2 Myr. At 4–5 Myr the Pic2l retains dust in some discs, whereas the Kom2l has very little left. We note that the 3, 4, and 5 Myr lines of the Pic2l are on top of each other. The thin coloured lines in the left plot show the gas mass multiplied by the initial dust-to-gas ratio. This shows how the disc dust mass would evolve without any radial drift. The observed sample is colour coded according to the cluster’s oldest inferred age.
Current usage metrics show cumulative count of Article Views (full-text article views including HTML views, PDF and ePub downloads, according to the available data) and Abstracts Views on Vision4Press platform.
Data correspond to usage on the plateform after 2015. The current usage metrics is available 48-96 hours after online publication and is updated daily on week days.
Initial download of the metrics may take a while.