Fig. 11
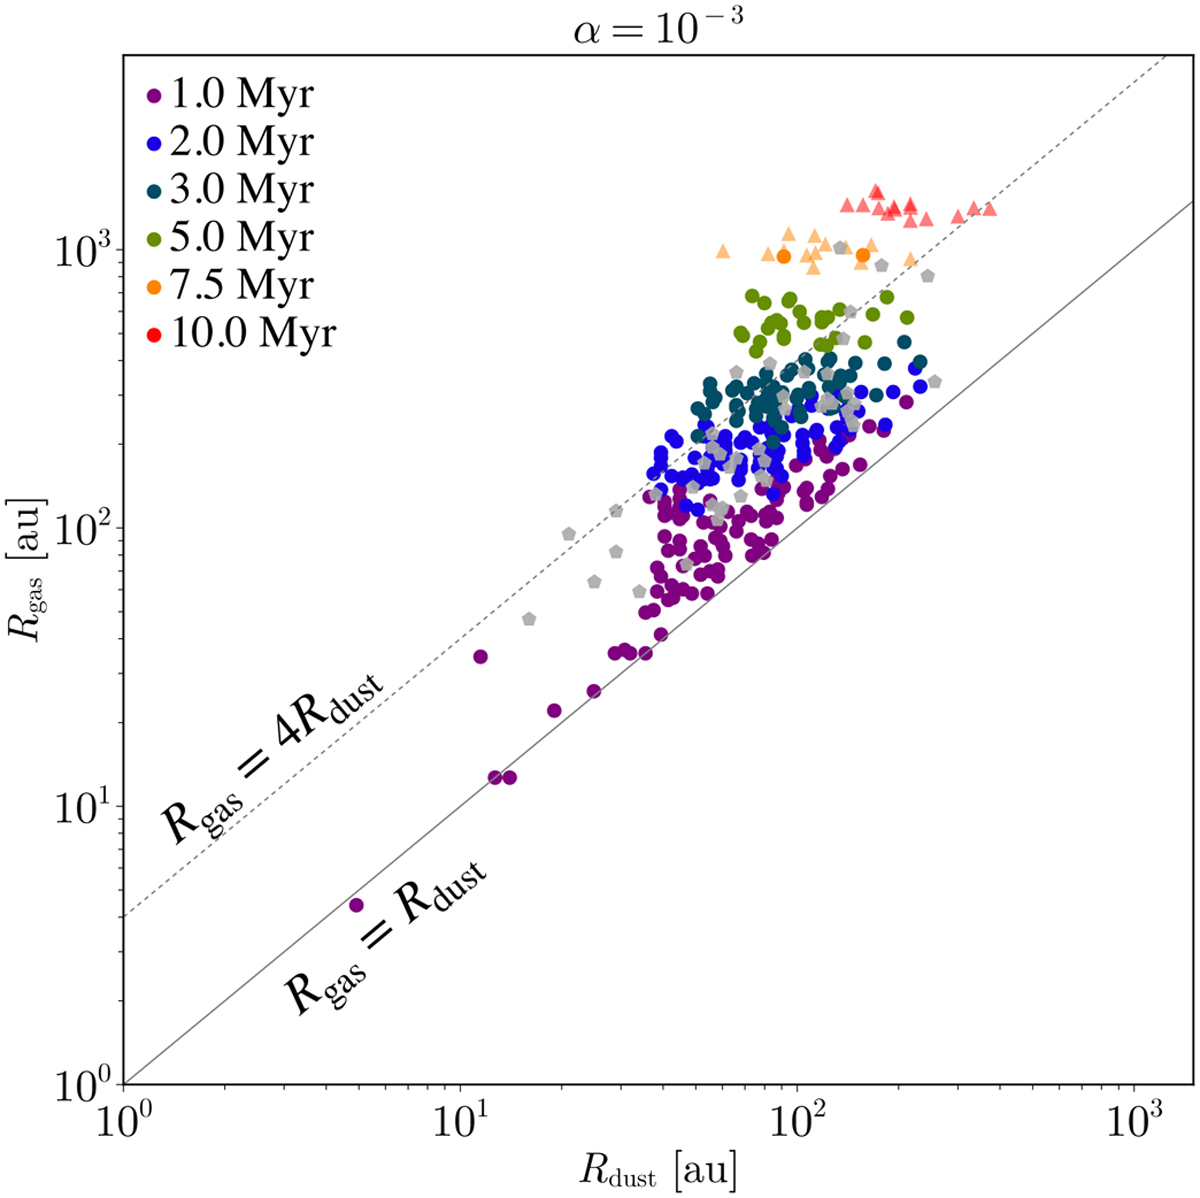
Download original image
Gas disc radius as a function of dust disc radius, using αν = 10−3 and the Pic21 photoevaporation prescription for different cluster ages. Triangles show discs which have retained more than 0.1 M⊕ of dust, but whose gas accretion rates are lower than 10−12 M⊙ Yr−1. These are the discs, corresponding to 15% of the initial disc population, in which photoevaporation has opened up a gap, with a detectable amount of dust is retained outside the gap. Grey markers show observational measurements from Long et al. (2022). Grey lines show the Rgas = Rdust (solid) and Rgas = 4Rdust (dashed).
Current usage metrics show cumulative count of Article Views (full-text article views including HTML views, PDF and ePub downloads, according to the available data) and Abstracts Views on Vision4Press platform.
Data correspond to usage on the plateform after 2015. The current usage metrics is available 48-96 hours after online publication and is updated daily on week days.
Initial download of the metrics may take a while.