Open Access
Fig. 21
Download original image
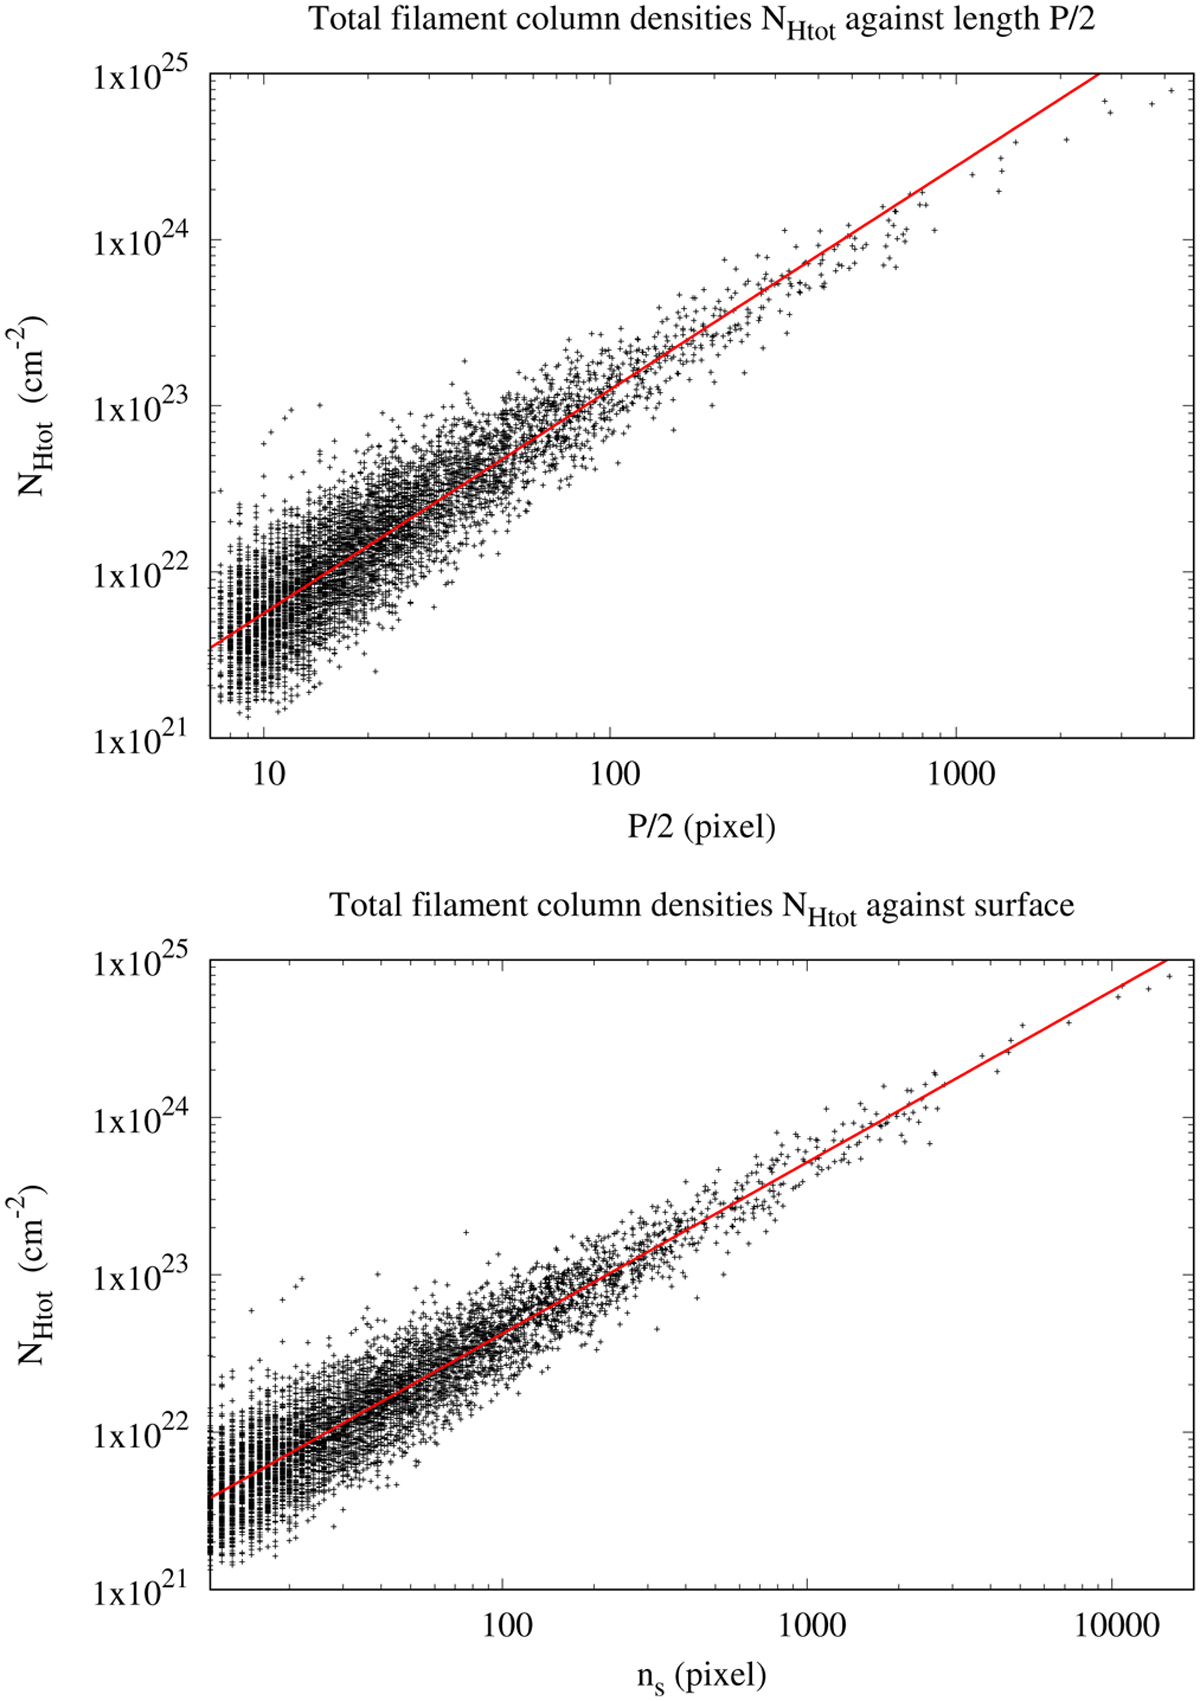
Distribution of total hydrogen column densities in filaments. Top: NHtot as a function of length P/2. The fit ln(NHtot) = 47.0 ± 0.02 + (1.345 ± 0.008) ln(P/2) is indicated by the red line. Bottom: NHtot as a function of surface nS and with the fit ln(NHtot) = 47.1 ± 0.02 + (1.089 ± 0.005) ln(nS) shown as a red line.
Current usage metrics show cumulative count of Article Views (full-text article views including HTML views, PDF and ePub downloads, according to the available data) and Abstracts Views on Vision4Press platform.
Data correspond to usage on the plateform after 2015. The current usage metrics is available 48-96 hours after online publication and is updated daily on week days.
Initial download of the metrics may take a while.