Fig. 9
Download original image
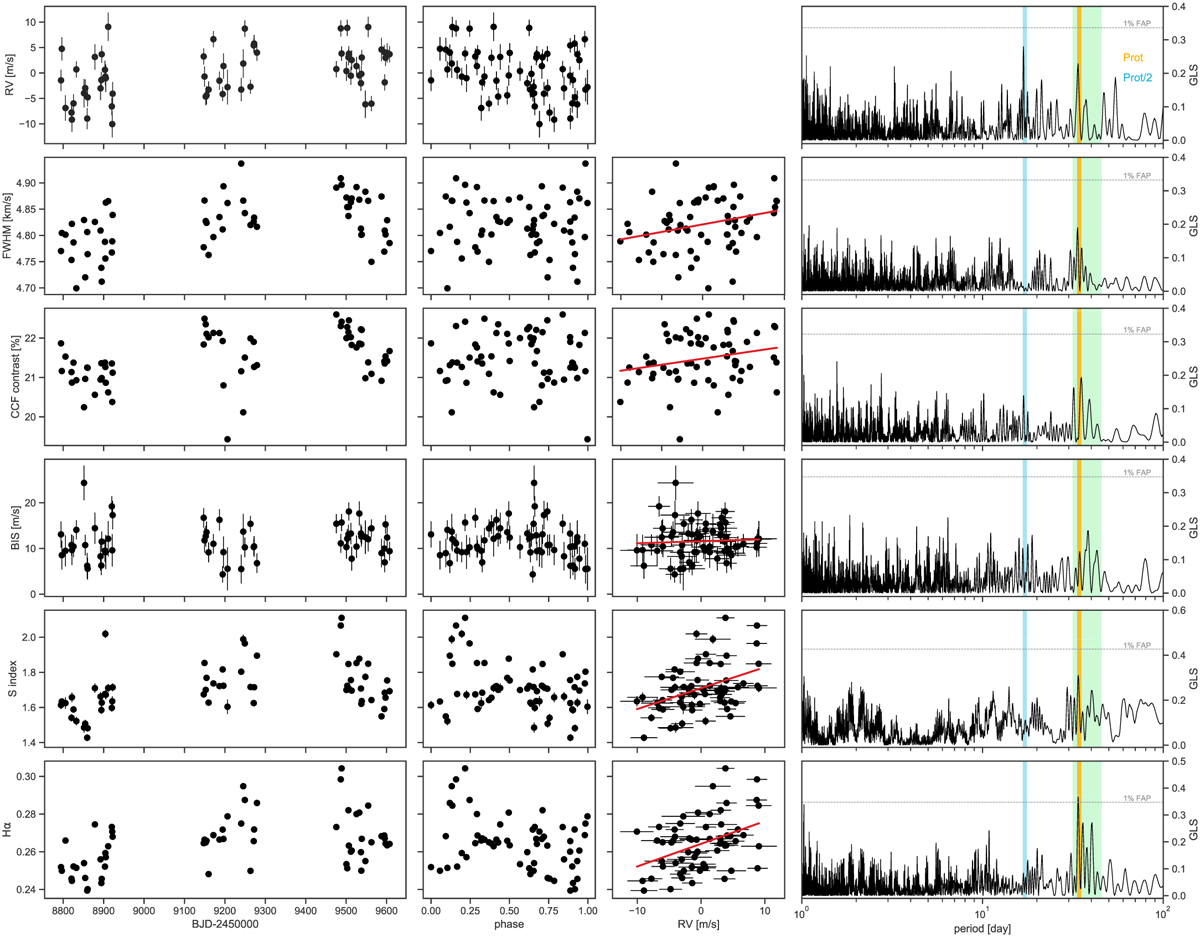
SOPHIE RVs and optical activity indicator. Left: time series; middle left: data folded at the Prot of 34.4 days; middle right: correlation with the RVs where the red line depicts the linear correlation between both quantities; right: GLS periodogram where the horizontal dashed black line indicates the FAP level at 1% and the vertical color lines mark the Prot at 34.4days in yellow, the first harmonic at Prot/2 in light blue, and the time range of differential rotation in light green.
Current usage metrics show cumulative count of Article Views (full-text article views including HTML views, PDF and ePub downloads, according to the available data) and Abstracts Views on Vision4Press platform.
Data correspond to usage on the plateform after 2015. The current usage metrics is available 48-96 hours after online publication and is updated daily on week days.
Initial download of the metrics may take a while.