Open Access
Fig. 7
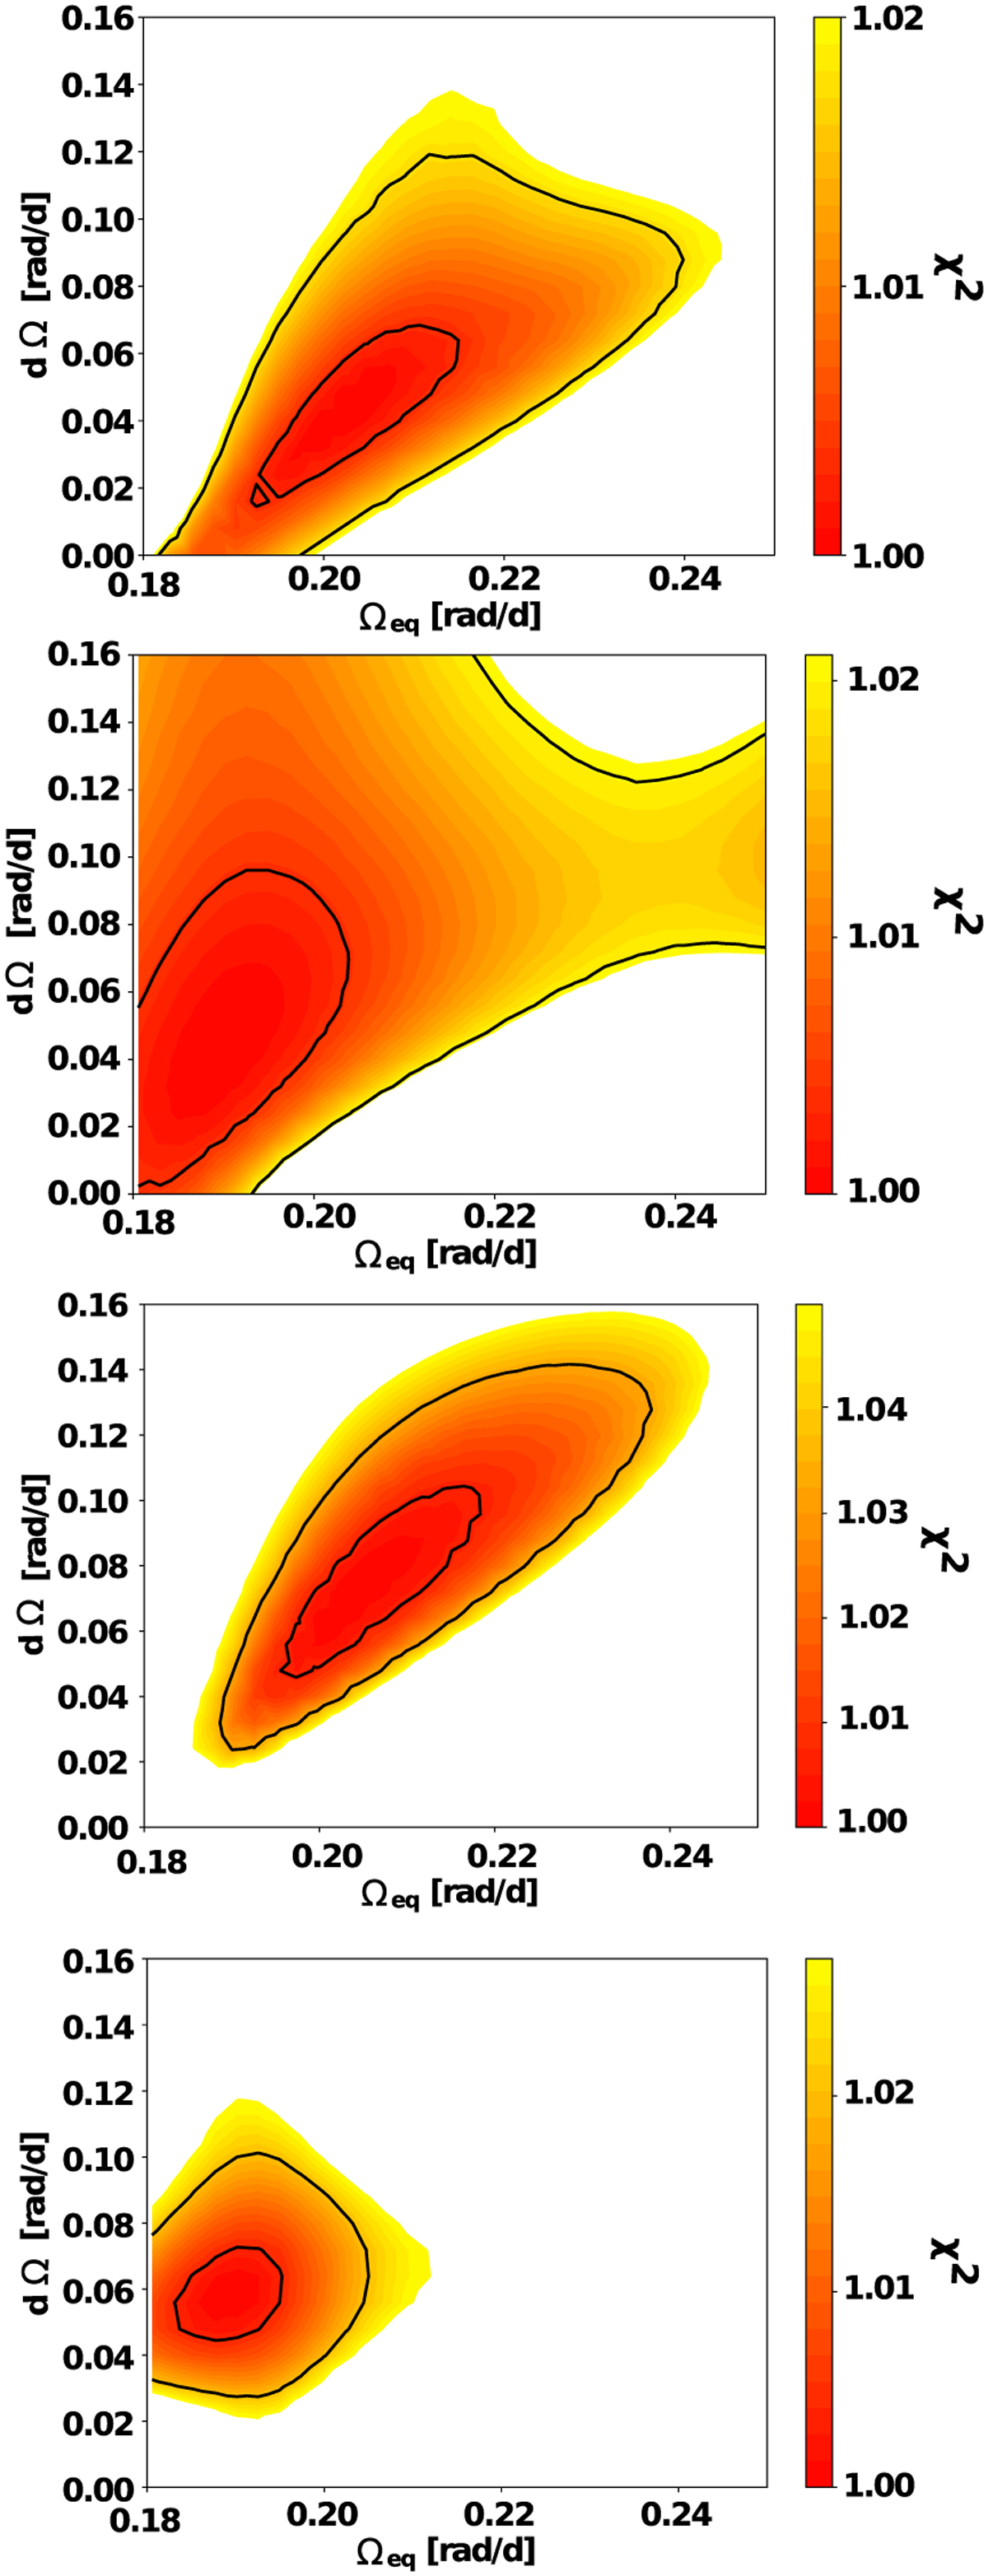
Download original image
Distribution of reduced χ2 as a function of Ωeq and dΩ extracted from the Stokes V LSD profiles in Season S1 to S4 defined in Table 4. In each map, the 1 and 3σ contours are indicated by the black solid lines.
Current usage metrics show cumulative count of Article Views (full-text article views including HTML views, PDF and ePub downloads, according to the available data) and Abstracts Views on Vision4Press platform.
Data correspond to usage on the plateform after 2015. The current usage metrics is available 48-96 hours after online publication and is updated daily on week days.
Initial download of the metrics may take a while.