Fig. 6
Download original image
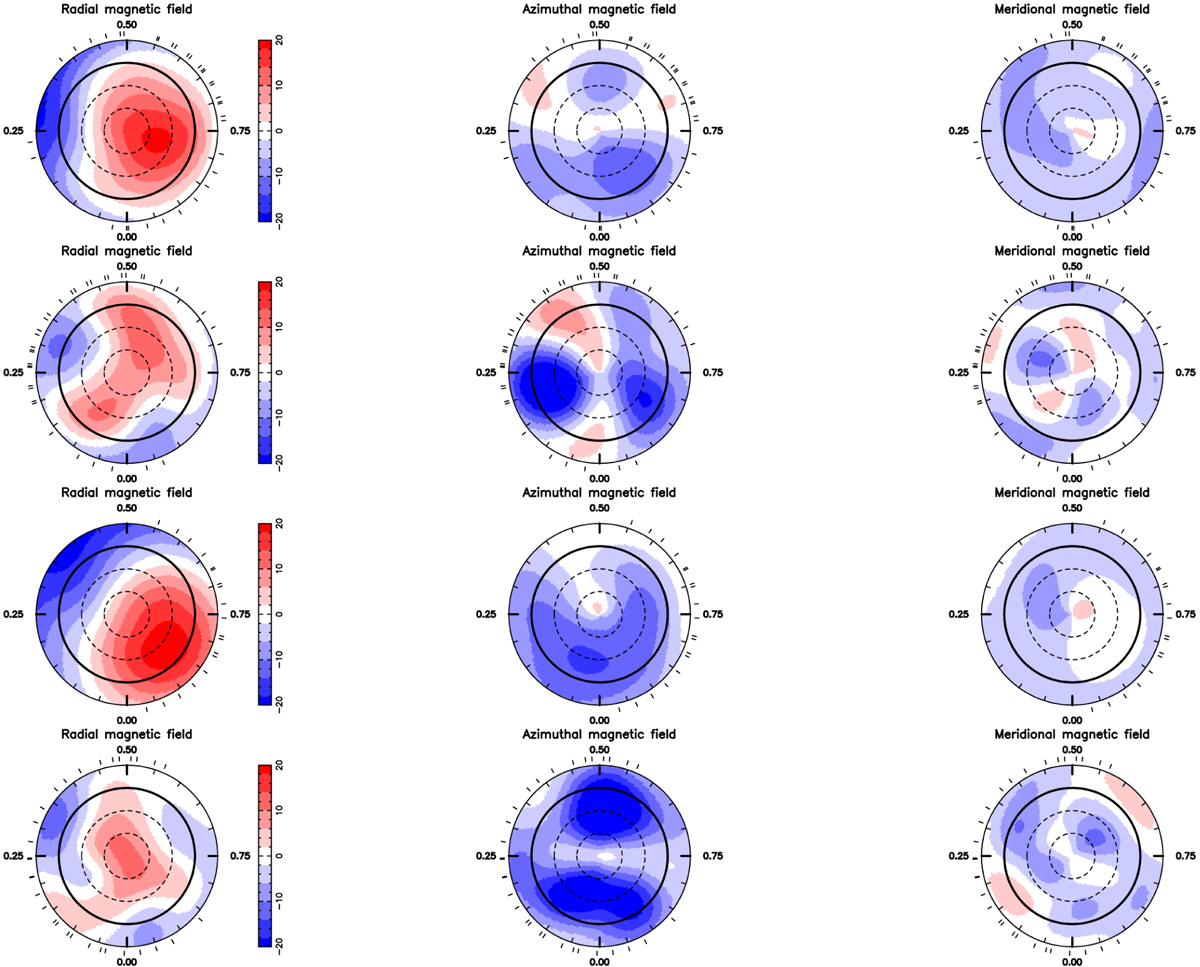
Radial, azimuthal and meridional components of the large-scale magnetic field at the surface of Gl 205 for the four subsets of data defined in Sect. 5.2. From top to bottom, the rows show the results for Seasons S1 (September-December 2019), S2 (August-October 2020), S3 (August–September 2021), and S4 (November 2021–January 2022). Each panel is a flattened polar view of the stellar surface. The circles indicate the equator (black solid line) and the –30, 30 and 60° parallels (dashed lines) and the ticks around the star mark the spectropolarimetric observations in unit of stellar rotation phase. The color bar depicts the magnetic flux in Gauss.
Current usage metrics show cumulative count of Article Views (full-text article views including HTML views, PDF and ePub downloads, according to the available data) and Abstracts Views on Vision4Press platform.
Data correspond to usage on the plateform after 2015. The current usage metrics is available 48-96 hours after online publication and is updated daily on week days.
Initial download of the metrics may take a while.