Open Access
Fig. 2
Download original image
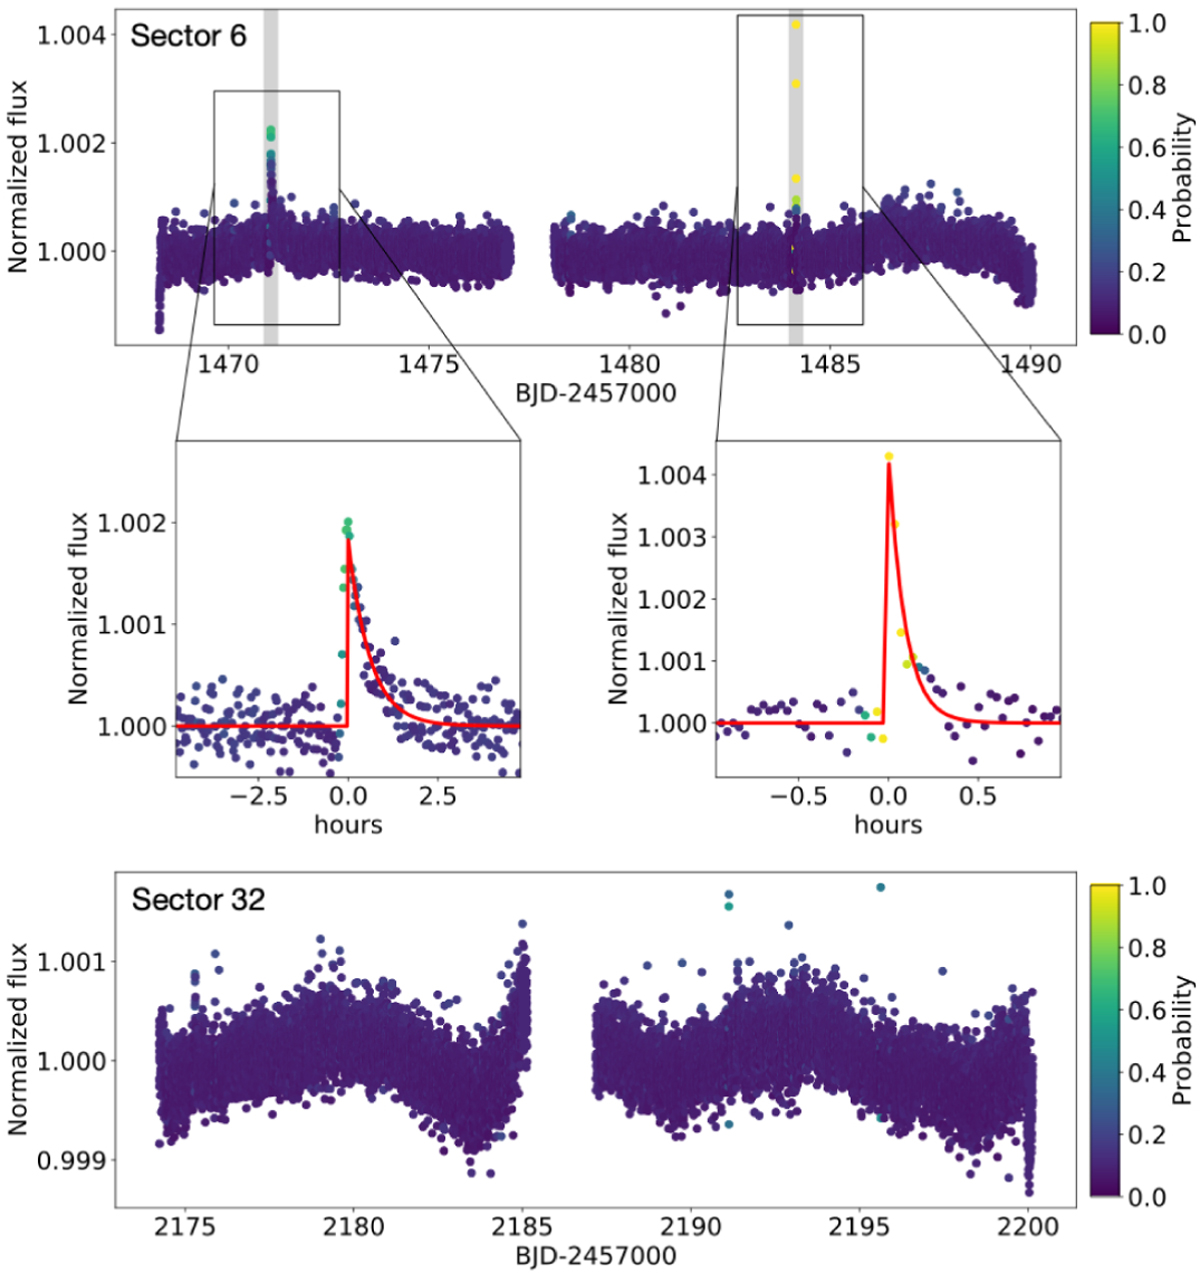
TESS light curves of Gl 205. Top: sector 6 data. Middle: zoom onto the region of the two flares identified in Sector 6 using the stella package. The red line depicts the best-fit flare model. Bottom: sector 32 data.
Current usage metrics show cumulative count of Article Views (full-text article views including HTML views, PDF and ePub downloads, according to the available data) and Abstracts Views on Vision4Press platform.
Data correspond to usage on the plateform after 2015. The current usage metrics is available 48-96 hours after online publication and is updated daily on week days.
Initial download of the metrics may take a while.