Fig. D.1
Download original image
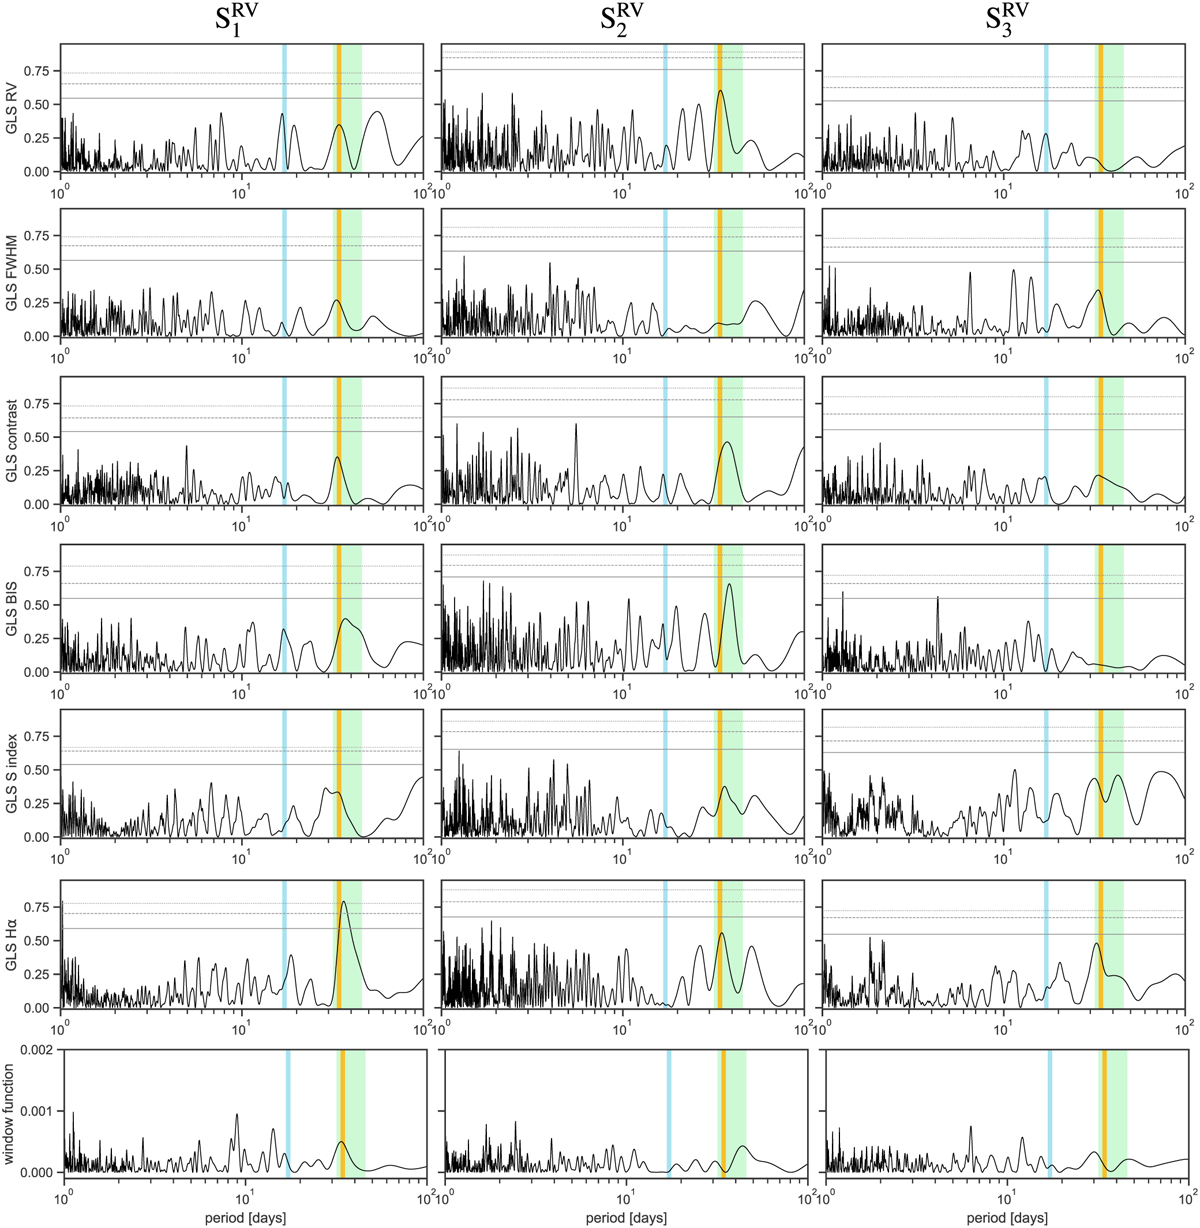
Generalized Lomb-Scargle periodograms of the SOPHIE RVs, activity indicators, and window function of the three seasons of RV observations: ![]() ,
, ![]() , and
, and ![]() . The vertical color lines mark the Prot at 34.4d in yellow, the first harmonic at Prot/2 in light blue, and the time range of differential rotation in light green between Peq = 32.0 d and Ppol = 45.5 days. The black horizontal lines indicate the FAP levels of 10% (solid), 1% (dashed), and 0.1% (dotted).
. The vertical color lines mark the Prot at 34.4d in yellow, the first harmonic at Prot/2 in light blue, and the time range of differential rotation in light green between Peq = 32.0 d and Ppol = 45.5 days. The black horizontal lines indicate the FAP levels of 10% (solid), 1% (dashed), and 0.1% (dotted).
Current usage metrics show cumulative count of Article Views (full-text article views including HTML views, PDF and ePub downloads, according to the available data) and Abstracts Views on Vision4Press platform.
Data correspond to usage on the plateform after 2015. The current usage metrics is available 48-96 hours after online publication and is updated daily on week days.
Initial download of the metrics may take a while.