Open Access
Fig. C.2
Download original image
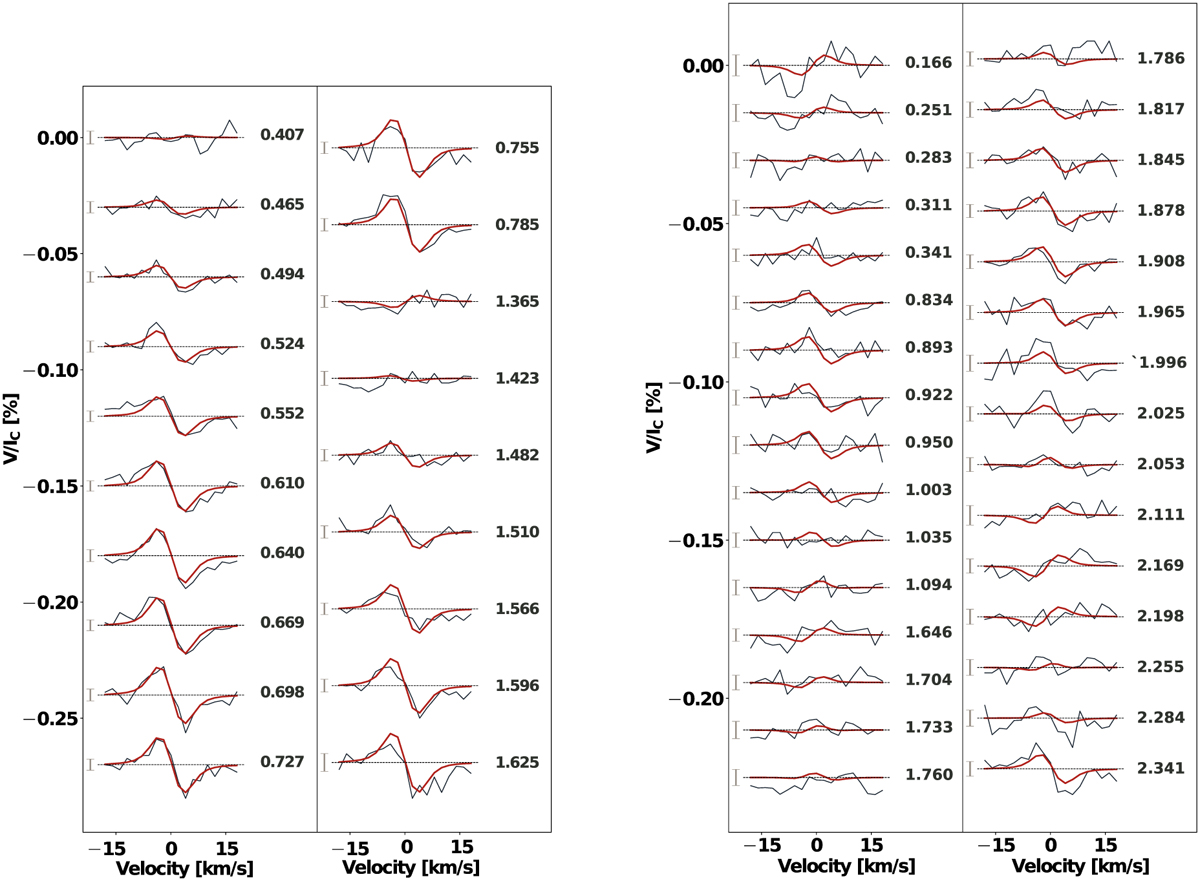
Same as Figure C.1, but for the observations collected in Season 3 (August to September 2021, left-hand panel), and Season 4 (November 2021 and January 2022, right-hand panel). We note that we use the same rotation period and reference time as in Figure C.1 to compute the stellar rotation phases.
Current usage metrics show cumulative count of Article Views (full-text article views including HTML views, PDF and ePub downloads, according to the available data) and Abstracts Views on Vision4Press platform.
Data correspond to usage on the plateform after 2015. The current usage metrics is available 48-96 hours after online publication and is updated daily on week days.
Initial download of the metrics may take a while.