Fig. 1
Download original image
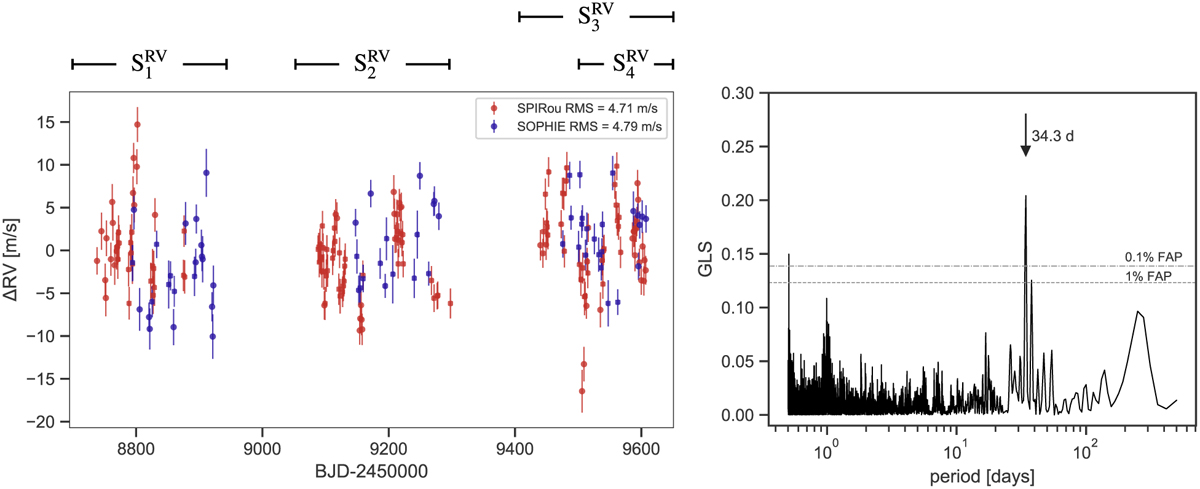
SOPHIE and SPIRou data of Gl 205. Left: RV time series of Gl 205 from SOPHIE in blue and SPIRou in red with an offset equal to the mean RV of each instrument, RVSOPHIE = 8727.8 m s−1 and RVSPIRou = 9345.5 m s−1. The scatter in the time series is 4.7 m s−1 in the SPIRou data set and 4.8 m s−1 in SOPHIE. The labels above the time series depict the four subsets of observations described in Sect. 6. Right: GLS periodogram of the full RV time series, combining SOPHIE and SPIRou observations. The highest peak is marked with an arrow at 34.3 days.
Current usage metrics show cumulative count of Article Views (full-text article views including HTML views, PDF and ePub downloads, according to the available data) and Abstracts Views on Vision4Press platform.
Data correspond to usage on the plateform after 2015. The current usage metrics is available 48-96 hours after online publication and is updated daily on week days.
Initial download of the metrics may take a while.