Open Access
Fig. 8.
Download original image
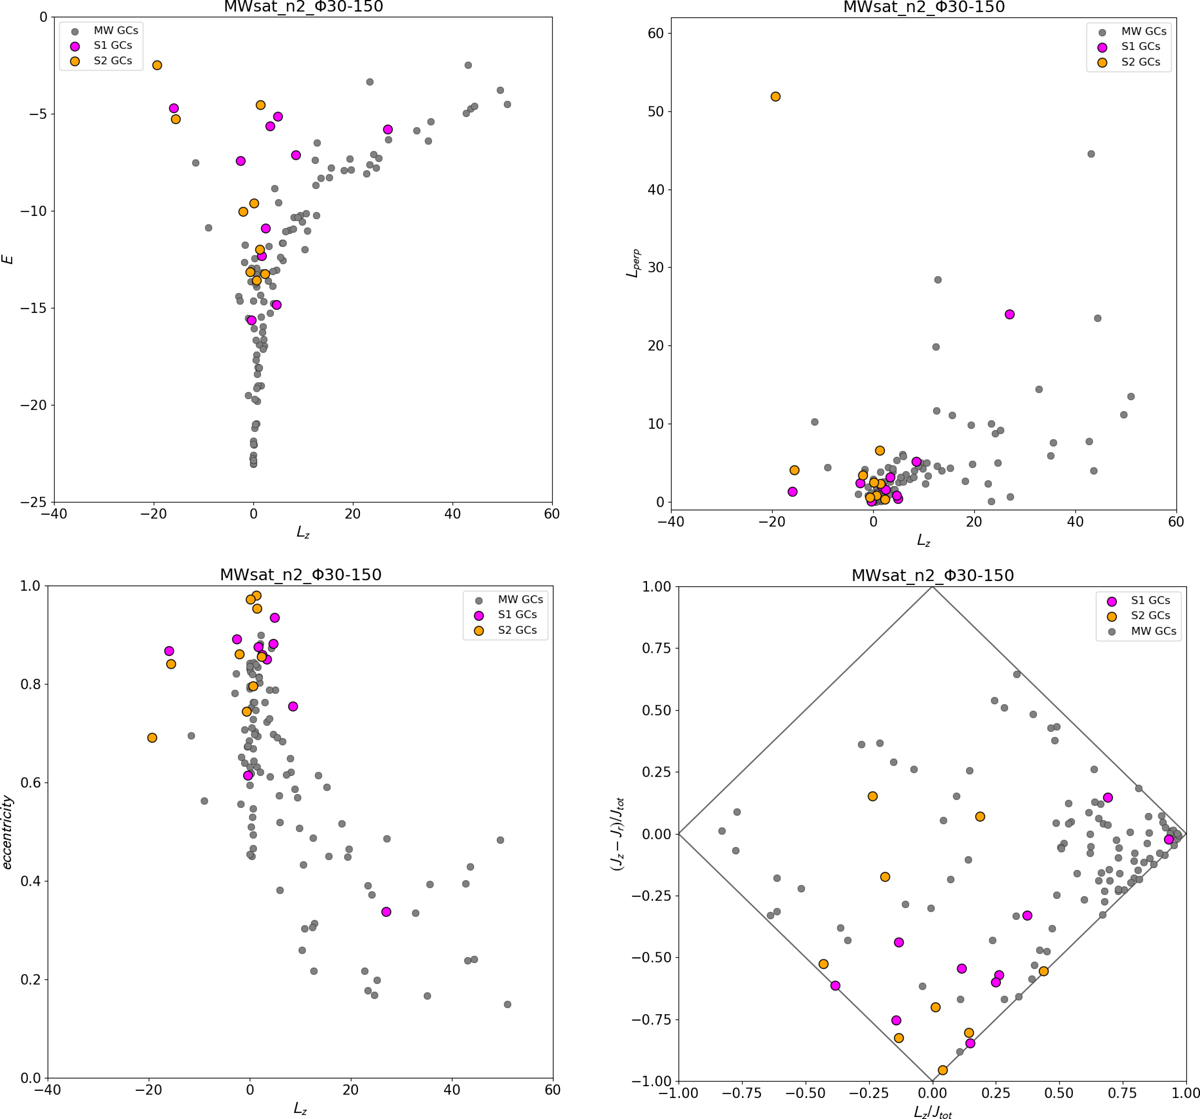
Final GC distributions in the kinematic spaces E − Lz, Lperp − Lz, eccentricity − Lz, and the action space for the simulation MWsat_n2_Φ30-150. The in situ population of GCs is represented by grey circles, while the accreted populations are indicated with magenta for satellite 1 and orange for satellite 2.
Current usage metrics show cumulative count of Article Views (full-text article views including HTML views, PDF and ePub downloads, according to the available data) and Abstracts Views on Vision4Press platform.
Data correspond to usage on the plateform after 2015. The current usage metrics is available 48-96 hours after online publication and is updated daily on week days.
Initial download of the metrics may take a while.