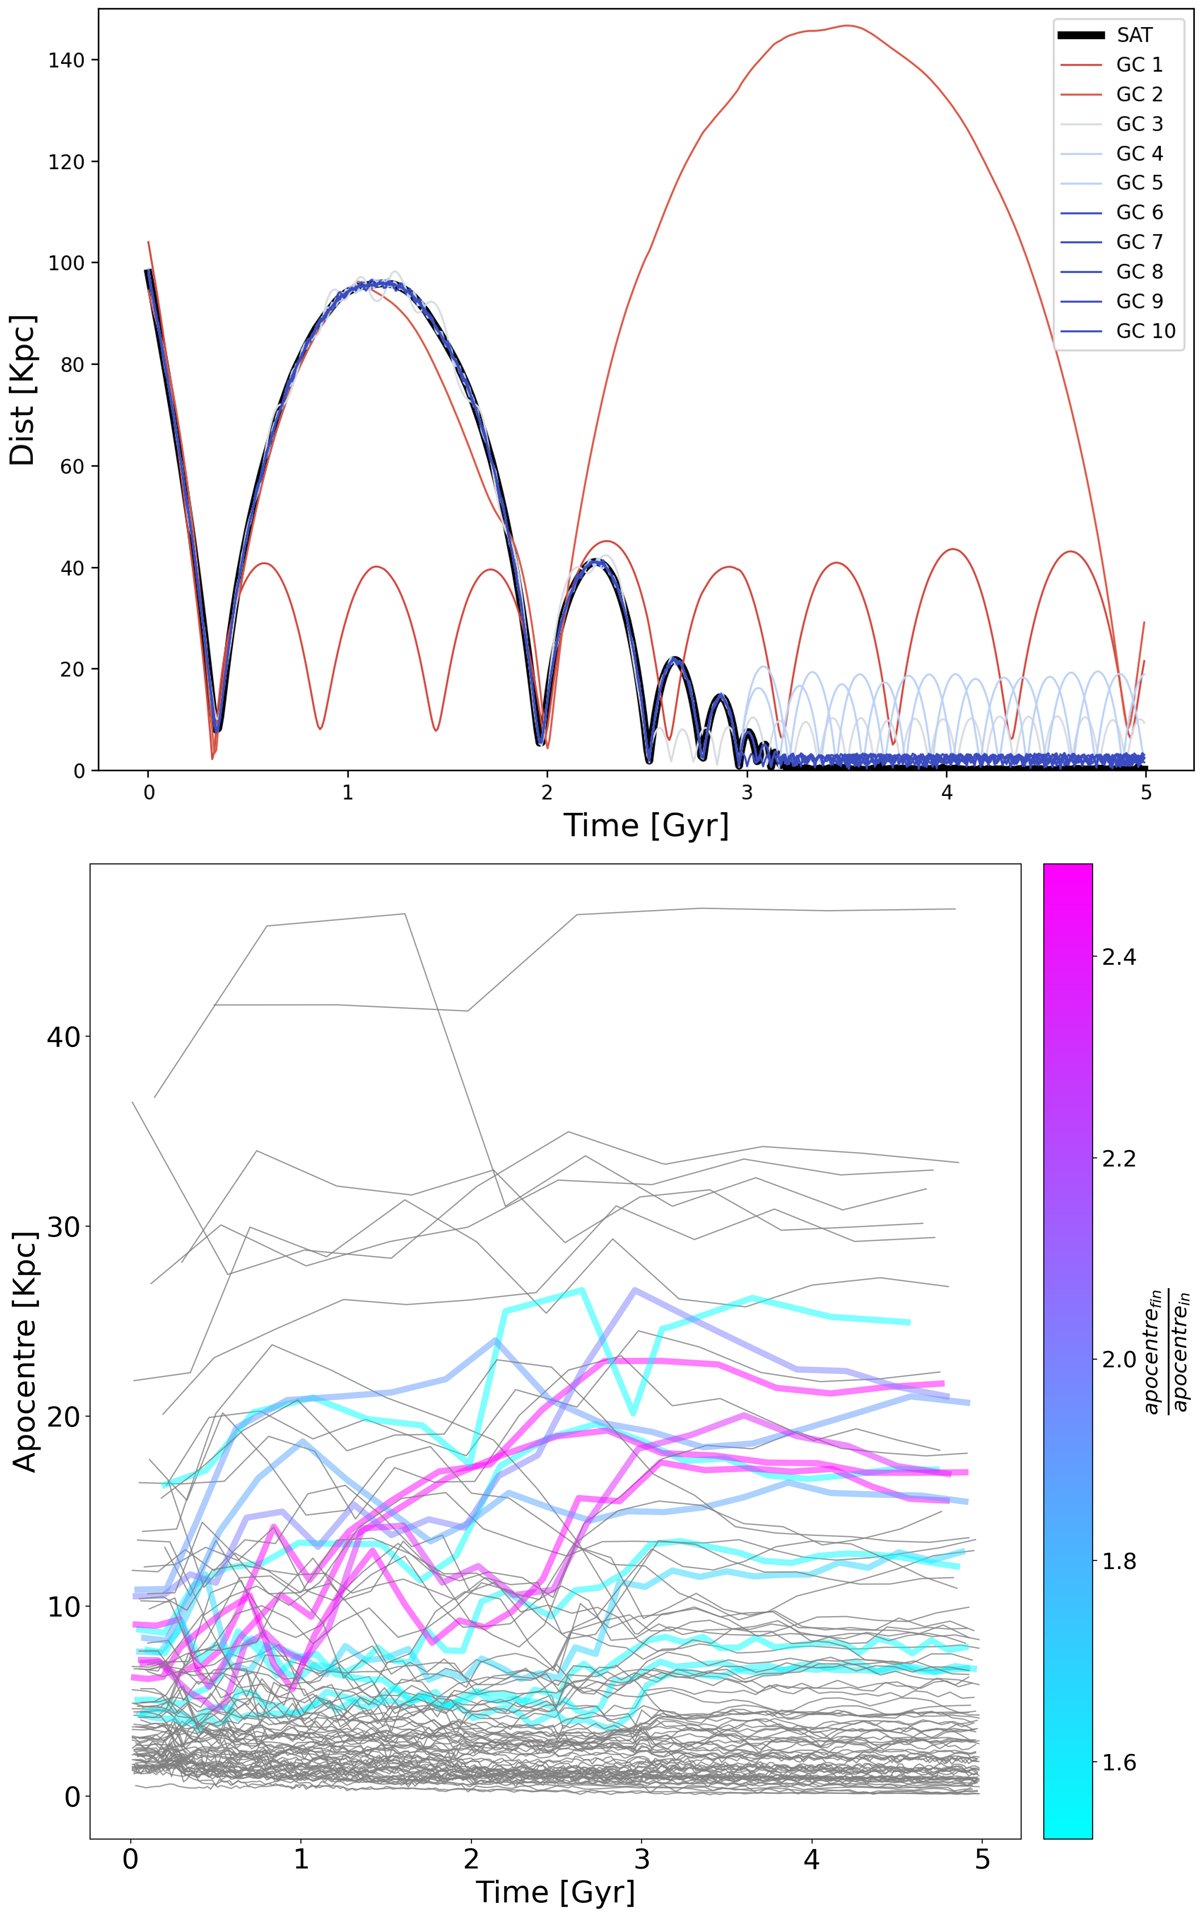
Fig. 2.
Download original image
Time evolution of accreted and in situ GCs distances from the MW-type galaxy. Top panel: time evolution of the distances of the satellite (black line) and its GCs (coloured lines) from the MW-type galaxy for the simulation MWsat_n1_Φ60. Each GC is colour-coded according to its escape time from the progenitor satellite. Bottom panel: time evolution of the apocentres of the orbits of all in situ clusters in the MW-type galaxy for the simulation MWsat_n1_Φ60. Thick and coloured lines indicate clusters whose orbital apocentres at the final time of the simulation are at least 1.5 times larger than their corresponding initial values. The lines are colour-coded according to the ratio of the final apocentre over the initial apocentre.
Current usage metrics show cumulative count of Article Views (full-text article views including HTML views, PDF and ePub downloads, according to the available data) and Abstracts Views on Vision4Press platform.
Data correspond to usage on the plateform after 2015. The current usage metrics is available 48-96 hours after online publication and is updated daily on week days.
Initial download of the metrics may take a while.