Fig. A.3.
Download original image
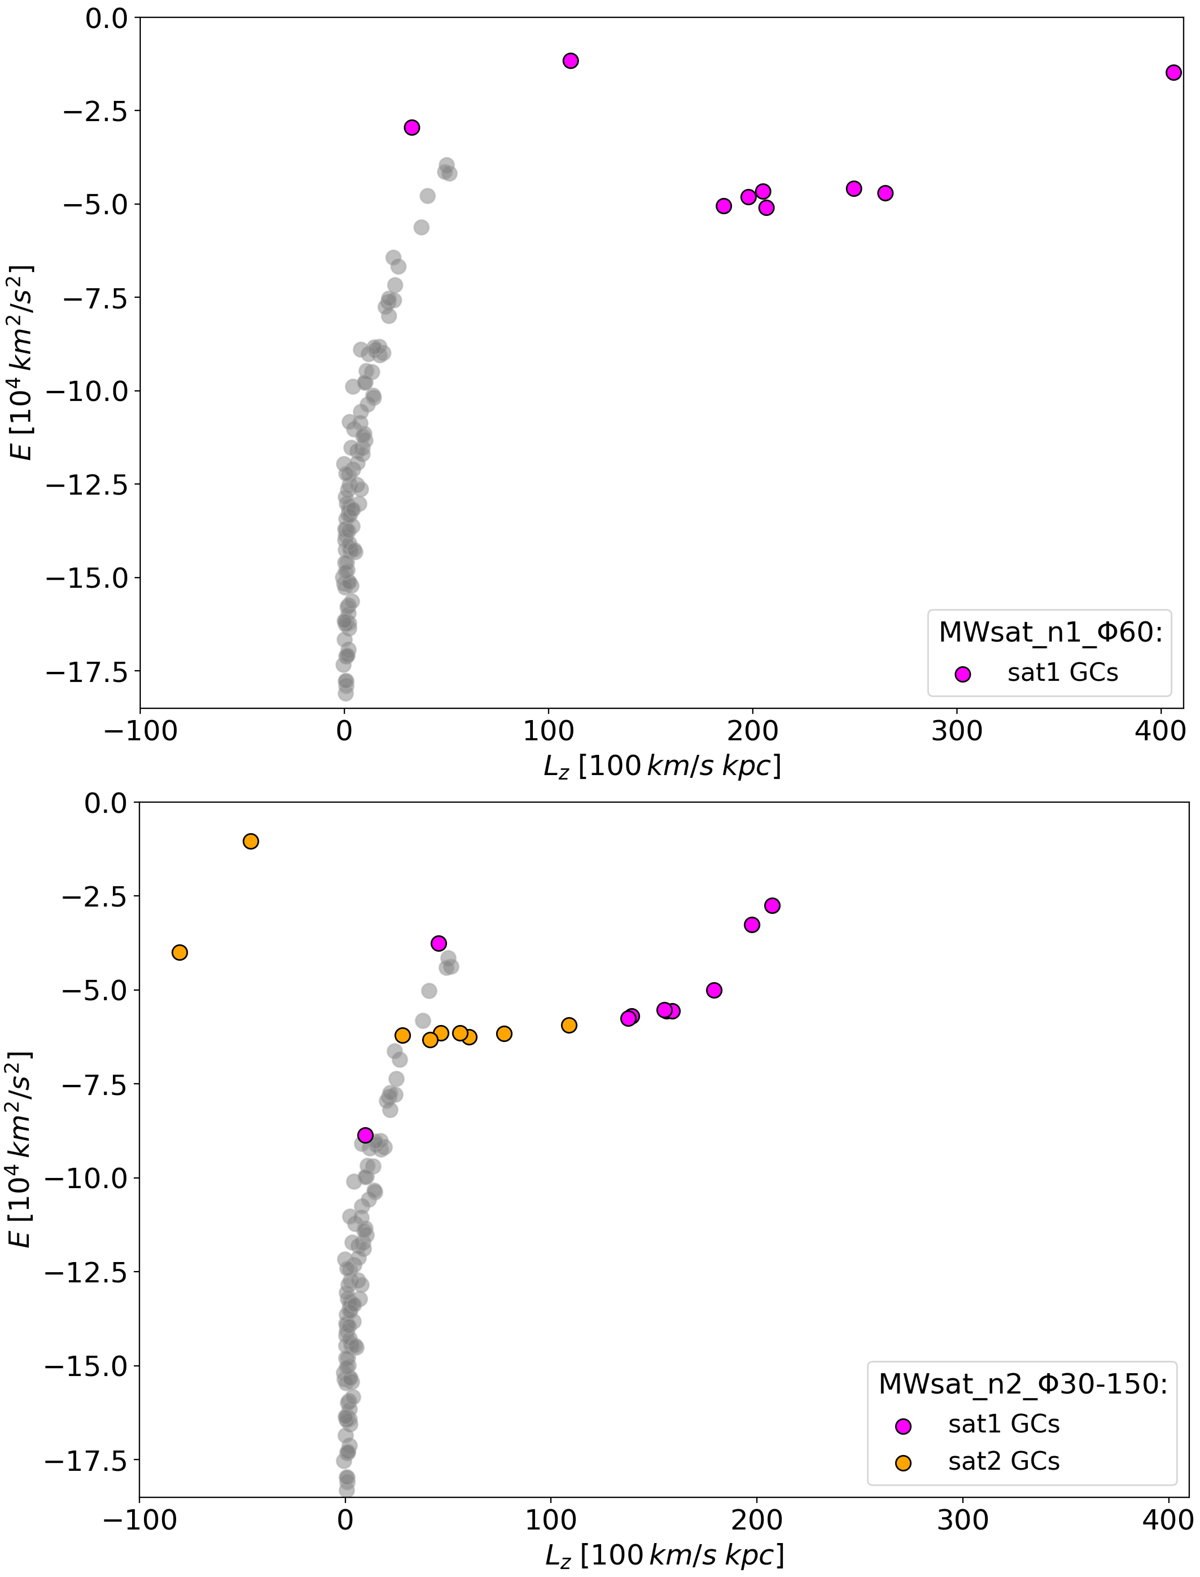
Distribution of GCs in the E − Lz space at the end of the simulations. Top panel: Distribution from the single-accretion simulation (MWsat_n1_Φ60). Bottom panel: Distribution from the double accretion simulation (MWsat_n2_Φ30-150). The MW’s GCs are identified as grey circles, while satellite(s) GCs are represented as magenta and orange circles.
Current usage metrics show cumulative count of Article Views (full-text article views including HTML views, PDF and ePub downloads, according to the available data) and Abstracts Views on Vision4Press platform.
Data correspond to usage on the plateform after 2015. The current usage metrics is available 48-96 hours after online publication and is updated daily on week days.
Initial download of the metrics may take a while.