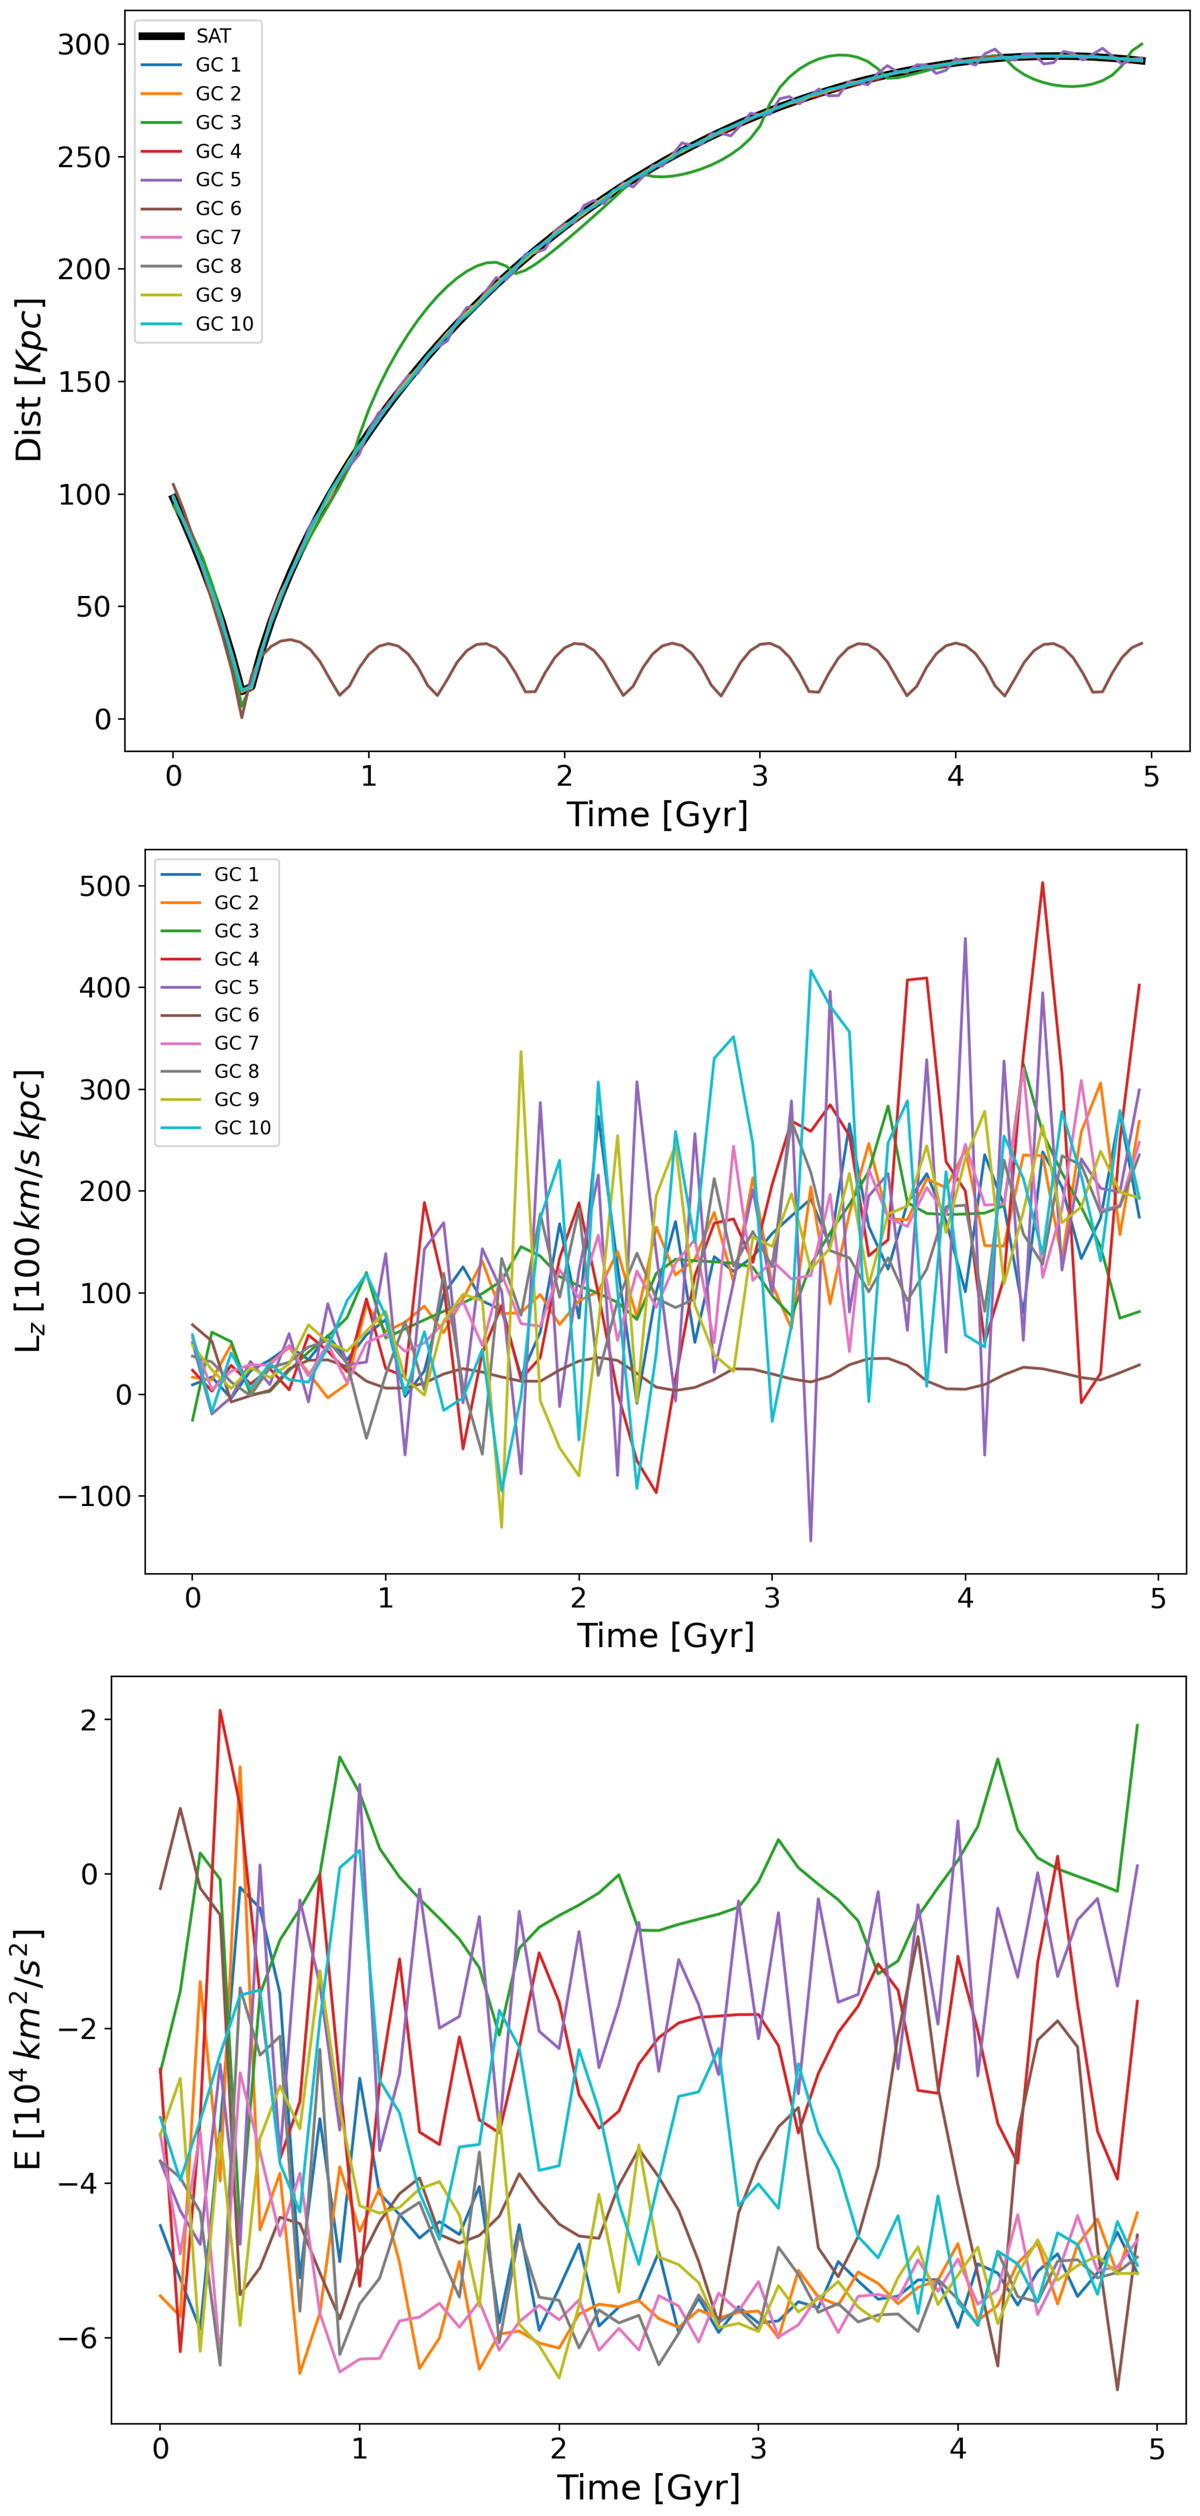
Fig. A.2.
Download original image
Time evolution of distances, angular momenta and orbital energies of satellite GCs. Top panel: Time evolution of the distances of the satellite (black line) and its GCs (coloured lines) from the MW-type galaxy for the simulation with a fixed MW potential MWsat_n1_Φ60. Middle panel: Time evolution of the angular momenta of the satellite GCs. Bottom panel: Time evolution of the orbital energies of the satellite GCs.
Current usage metrics show cumulative count of Article Views (full-text article views including HTML views, PDF and ePub downloads, according to the available data) and Abstracts Views on Vision4Press platform.
Data correspond to usage on the plateform after 2015. The current usage metrics is available 48-96 hours after online publication and is updated daily on week days.
Initial download of the metrics may take a while.