Fig. 15.
Download original image
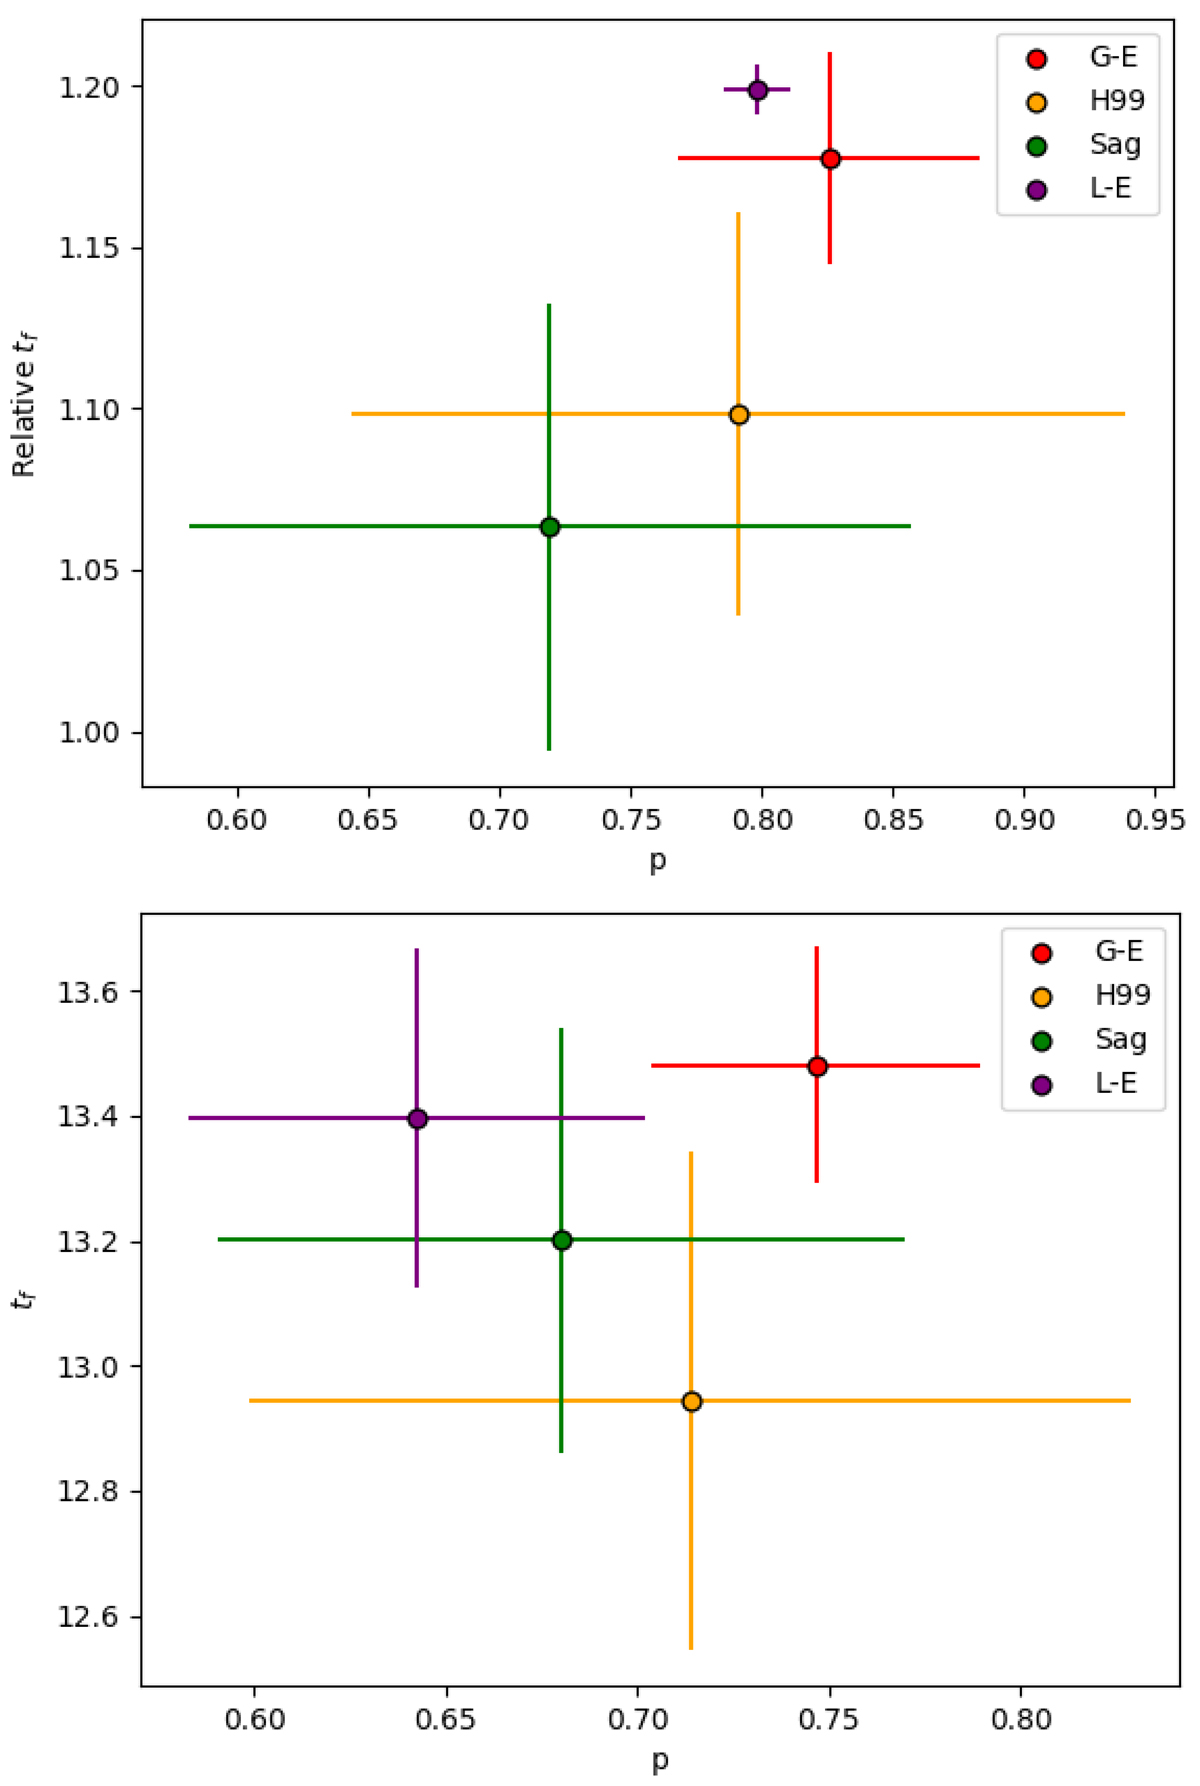
Time, tf, when the chemical enrichment started as a function of the effective yield p for the four different groups reported in Fig. 14. Top panel: the p and tf values are obtained from fitting the AMR of Marín-Franch et al. (2009). Bottom panel: the p and tf values are obtained from fitting the AMR of VandenBerg et al. (2013).
Current usage metrics show cumulative count of Article Views (full-text article views including HTML views, PDF and ePub downloads, according to the available data) and Abstracts Views on Vision4Press platform.
Data correspond to usage on the plateform after 2015. The current usage metrics is available 48-96 hours after online publication and is updated daily on week days.
Initial download of the metrics may take a while.