Fig. 11.
Download original image
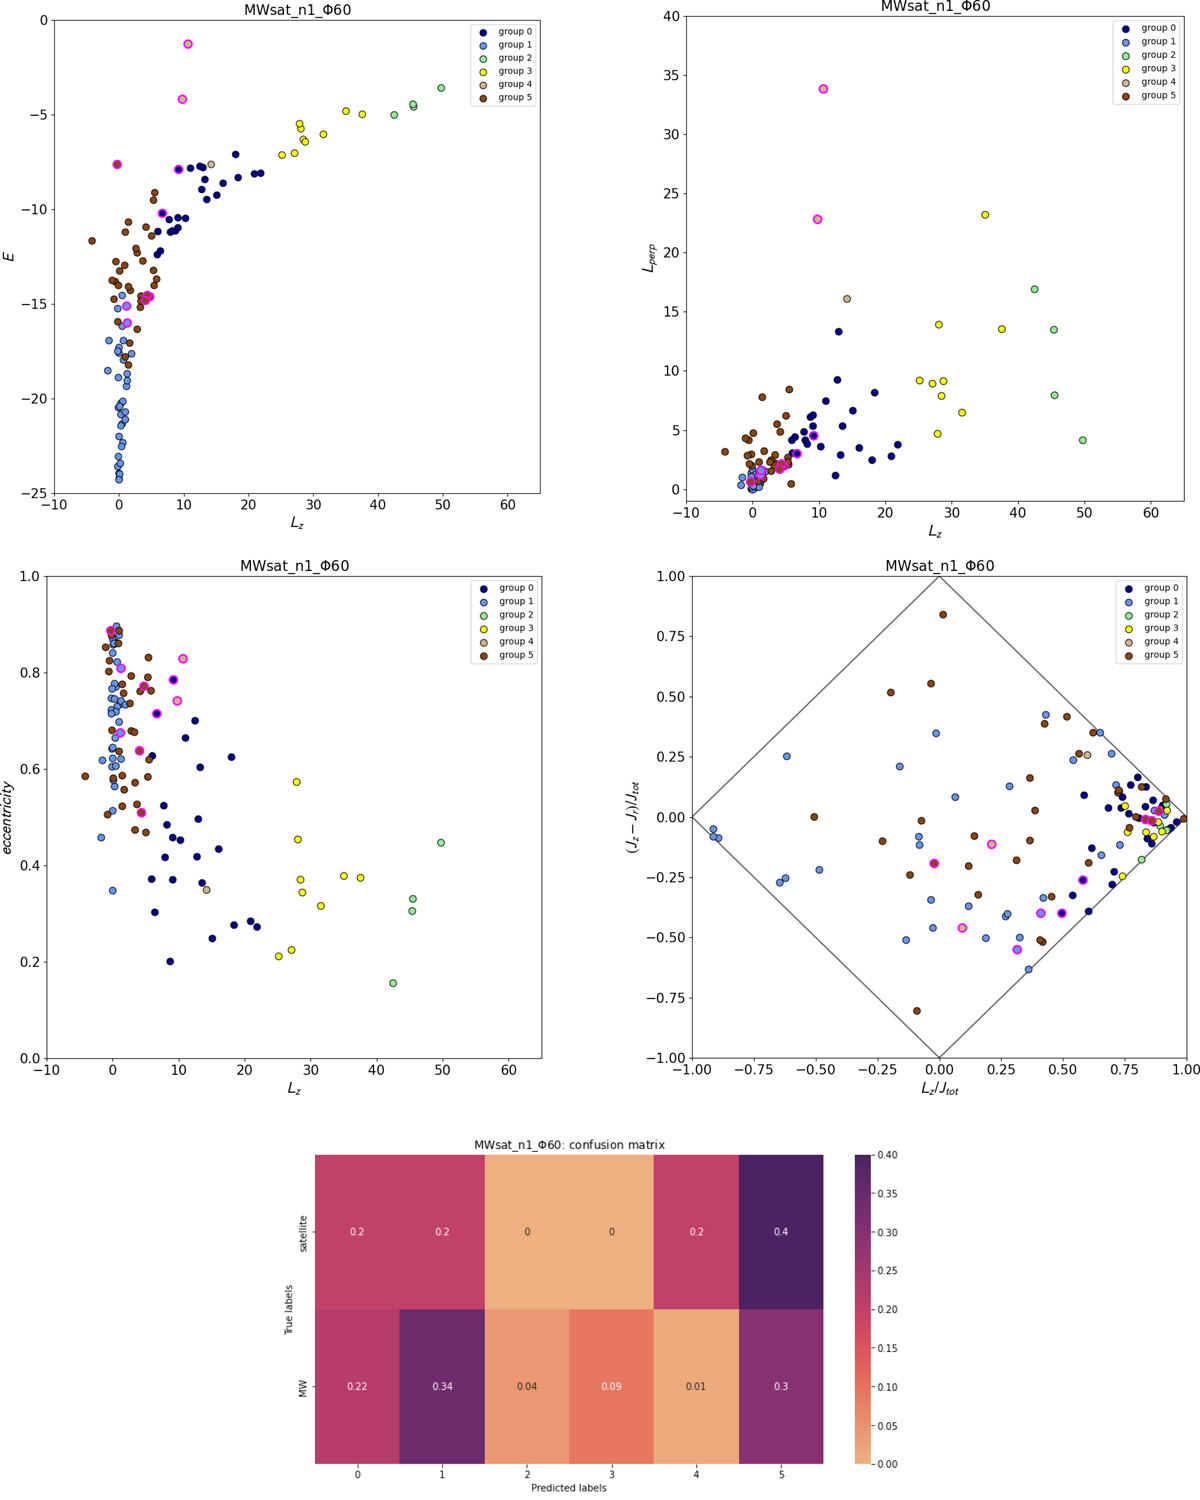
GMM applied to the GCs’ kinematic quantities obtained in the single accretion simulation. Top-middle row: Final GC distributions in the kinematic spaces E − Lz, Lperp − Lz, eccentricity − Lz, and the action space for the simulation MWsat_n1_Φ60. The colour coding of the GCs is related to the different components retrieved when applying the minimum BIC criterion in the GMM. Truly accreted GCs (i.e. those given the ‘true’ label by our simulation) are bordered by magenta circles. Bottom panel: Confusion matrix obtained by the GMM. Each row represents the true labels given by the simulations (MW, satellite), while each column represents the predicted group identified by the model. Values are normalised to the total number of GCs in each true class.
Current usage metrics show cumulative count of Article Views (full-text article views including HTML views, PDF and ePub downloads, according to the available data) and Abstracts Views on Vision4Press platform.
Data correspond to usage on the plateform after 2015. The current usage metrics is available 48-96 hours after online publication and is updated daily on week days.
Initial download of the metrics may take a while.