Fig. 1.
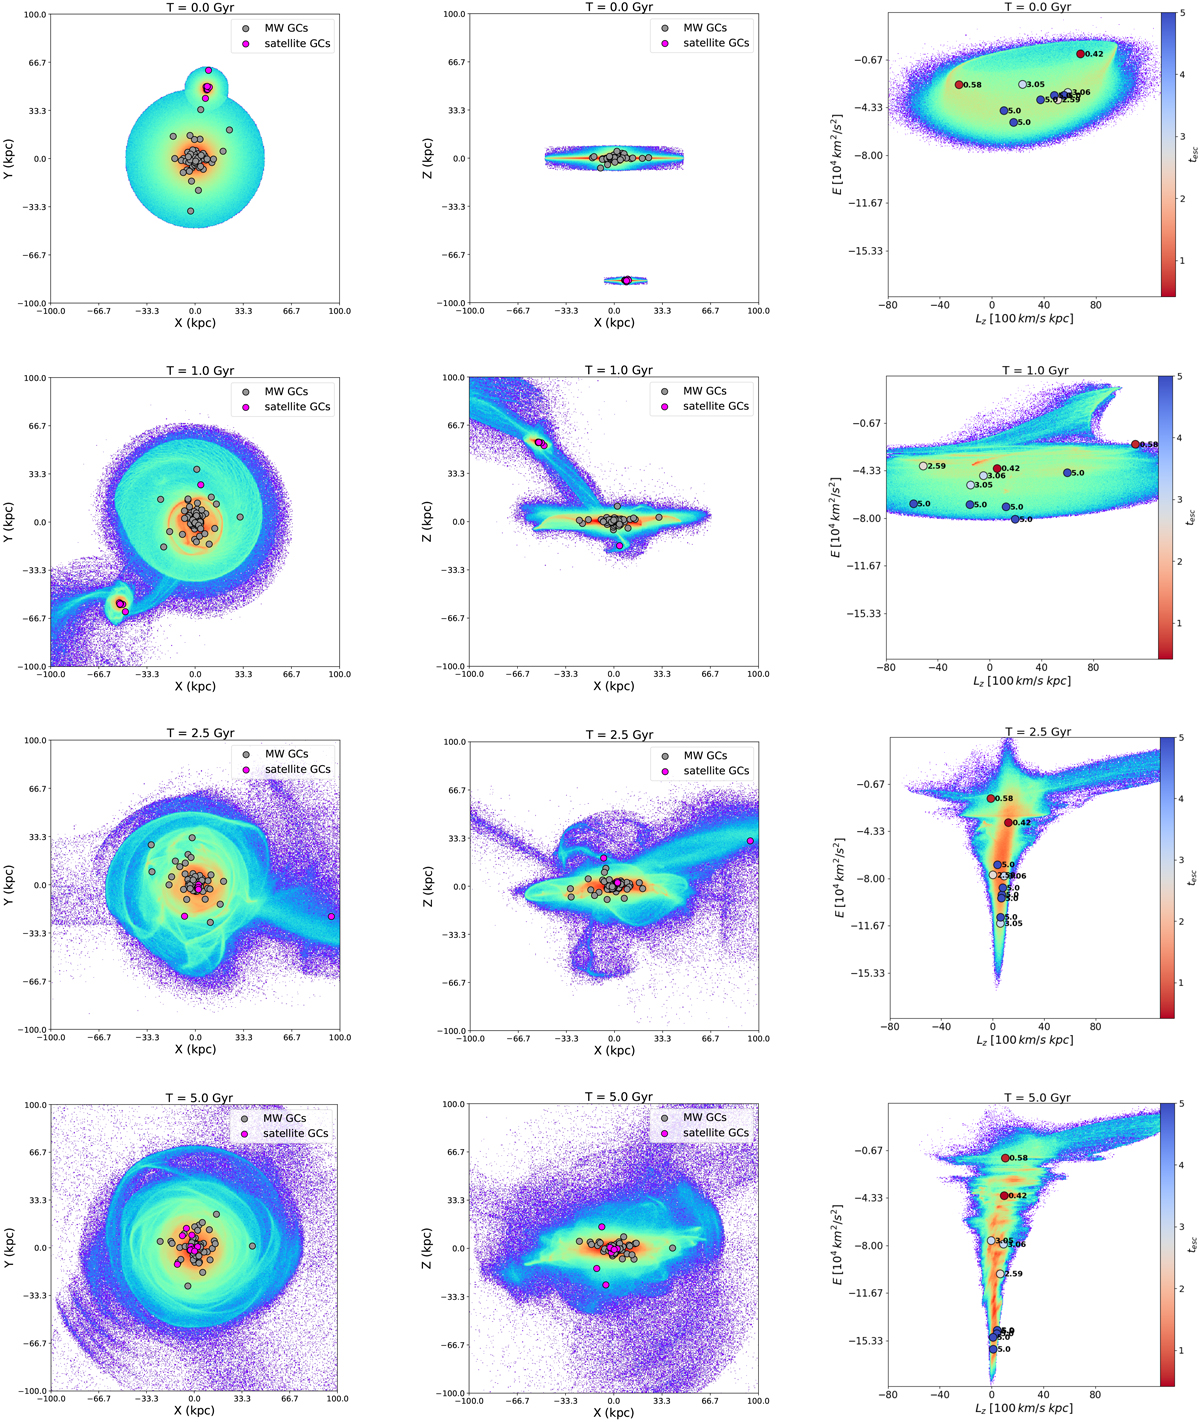
Download original image
Time evolution of the simulated merging process. Left, middle columns: projections of the simulated GC positions on the x − y and x − z planes for different times of the single-accretion simulation with Φorb = 60° (MWsat_n1_Φ60). (See Table 2 for the initial parameters.) The times increase from top to bottom. The in situ clusters are represented by grey circles and the accreted clusters by magenta circles. In the background, the surface density of the totality of the stars of the simulation is also shown. Right column: distributions of accreted GCs and field stars of the same satellite in the E − Lz space for different times of the single-accretion simulation MWsat_n1_Φ60. The times increase from top to bottom. Each GC is colour-coded according to its escape time from the progenitor satellite, which is also specified by the number on the top right and increases from 0.42 Gyr for GC1 to 5 Gyr for GC10 (see Sect. 3.2 for the definition of tesc).
Current usage metrics show cumulative count of Article Views (full-text article views including HTML views, PDF and ePub downloads, according to the available data) and Abstracts Views on Vision4Press platform.
Data correspond to usage on the plateform after 2015. The current usage metrics is available 48-96 hours after online publication and is updated daily on week days.
Initial download of the metrics may take a while.