Fig. 9.
Download original image
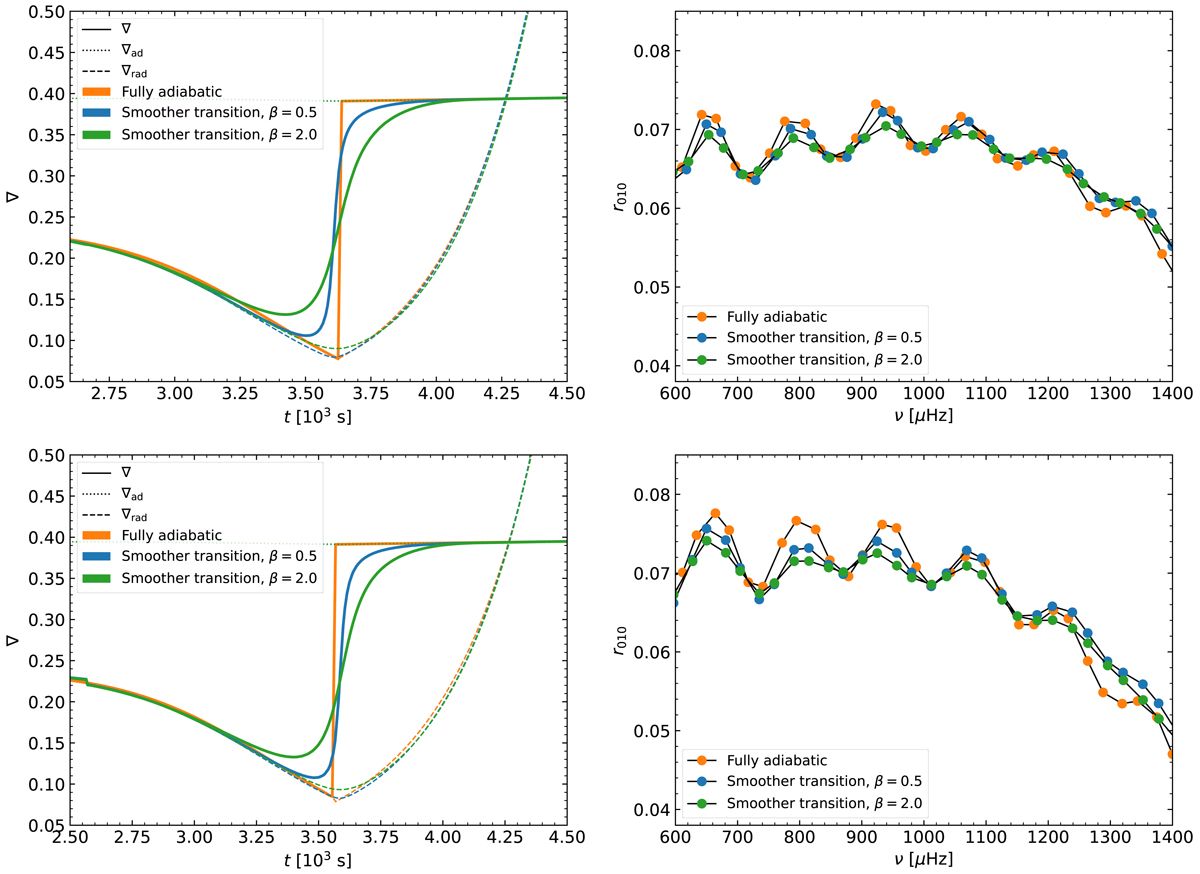
Impact of the μ-gradient and of the smoothness of the temperature gradient on the r010 ratios. Left: temperature gradients of model B2 (orange), B3 (blue), and B4 (green) for the top panel, and A5 (orange), A6 (blue), and A7 (green) for the bottom panel as a function of the acoustic radius at Xc = 0.10. Right: corresponding r010 ratios as a function of the frequency.
Current usage metrics show cumulative count of Article Views (full-text article views including HTML views, PDF and ePub downloads, according to the available data) and Abstracts Views on Vision4Press platform.
Data correspond to usage on the plateform after 2015. The current usage metrics is available 48-96 hours after online publication and is updated daily on week days.
Initial download of the metrics may take a while.