Fig. 9.
Download original image
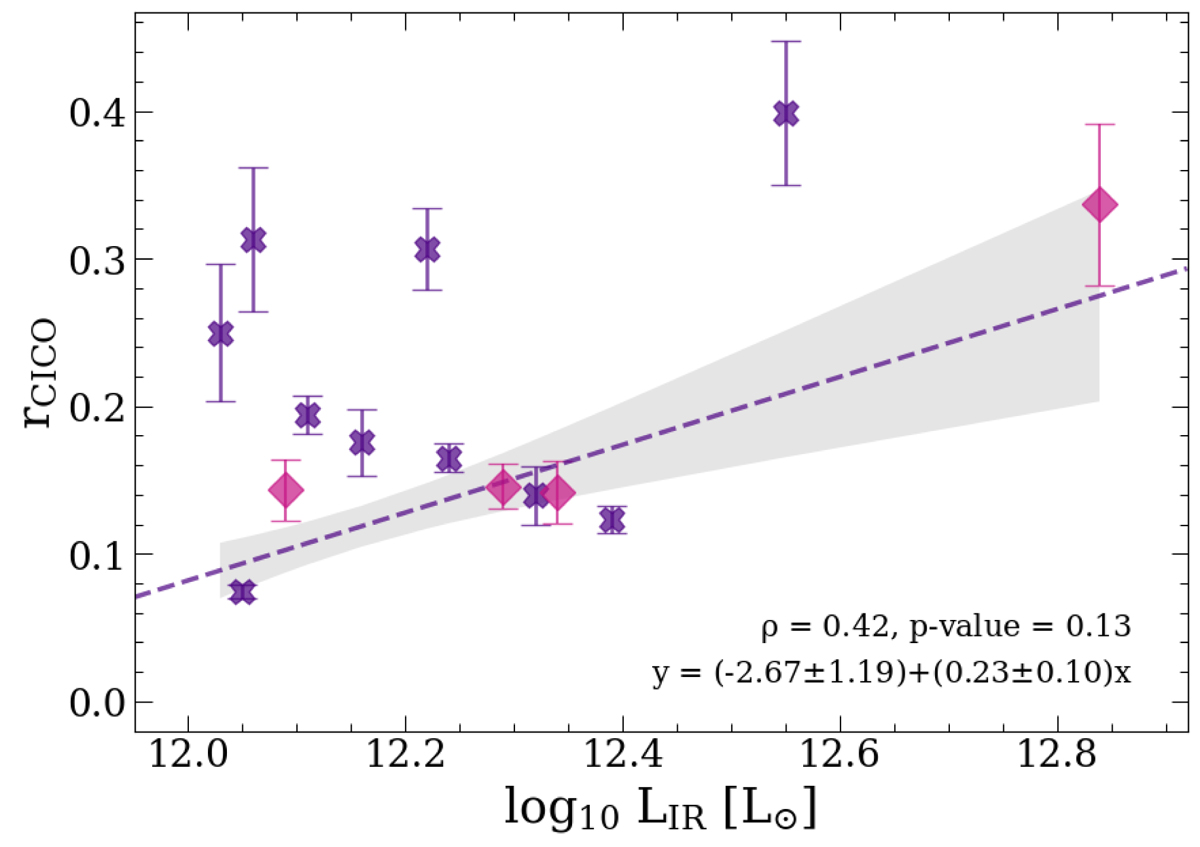
rCICO as a function of LIR for our sample of ULIRGs. Similar relations with other galaxy properties are reported in Fig. E.1. Sources with direct measurements of both the [CI](1–0) and CO(1–0) lines are plotted using purple crosses. The pink diamonds represent sources observed in [CI](1–0) but without CO(1–0) line data, for which we inferred ![]() from the CO(2–1) line luminosity by assuming r21 = 1.1, which is the mean value computed for our sample (see Fig. 6). The dashed purple line represents the best fit using a least squares regression analysis, and the shaded gray area corresponds to the 1σ confidence interval of the fit. The Pearson correlation coefficients (ρ) are reported at the upper-left corner of the panel with their associated p-values.
from the CO(2–1) line luminosity by assuming r21 = 1.1, which is the mean value computed for our sample (see Fig. 6). The dashed purple line represents the best fit using a least squares regression analysis, and the shaded gray area corresponds to the 1σ confidence interval of the fit. The Pearson correlation coefficients (ρ) are reported at the upper-left corner of the panel with their associated p-values.
Current usage metrics show cumulative count of Article Views (full-text article views including HTML views, PDF and ePub downloads, according to the available data) and Abstracts Views on Vision4Press platform.
Data correspond to usage on the plateform after 2015. The current usage metrics is available 48-96 hours after online publication and is updated daily on week days.
Initial download of the metrics may take a while.