Fig. 7.
Download original image
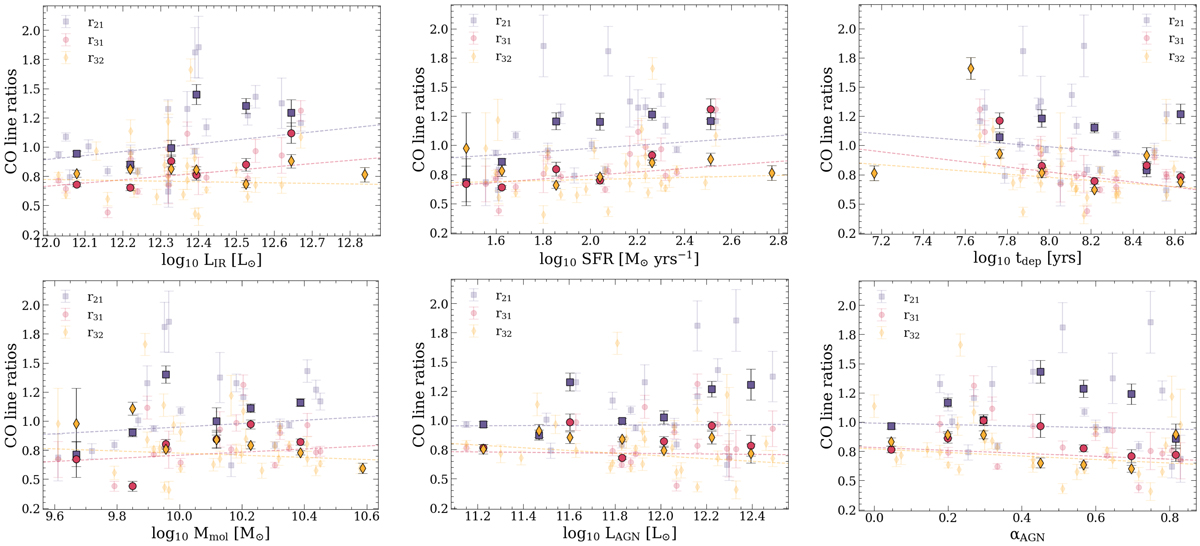
CO line ratios as a function of galaxy properties: LIR (top left), SFR (top middle), molecular gas depletion timescale due to star formation τdep ≡ Mmol/SFR (top right), molecular gas mass Mmol (computed by using the average αCO derived in this work; bottom right), LAGN (bottom middle), and AGN fraction (LAGN/Lbol; bottom right). We show the binned values using darker colors, overplotted on the individual data points. Dashed lines indicate the best-fit relations obtained from a least squares regression analysis conducted for each transition line separately. The color coding refers to different line ratios, as indicated in the legend at the top-right corner of each plot.
Current usage metrics show cumulative count of Article Views (full-text article views including HTML views, PDF and ePub downloads, according to the available data) and Abstracts Views on Vision4Press platform.
Data correspond to usage on the plateform after 2015. The current usage metrics is available 48-96 hours after online publication and is updated daily on week days.
Initial download of the metrics may take a while.