Fig. 6.
Download original image
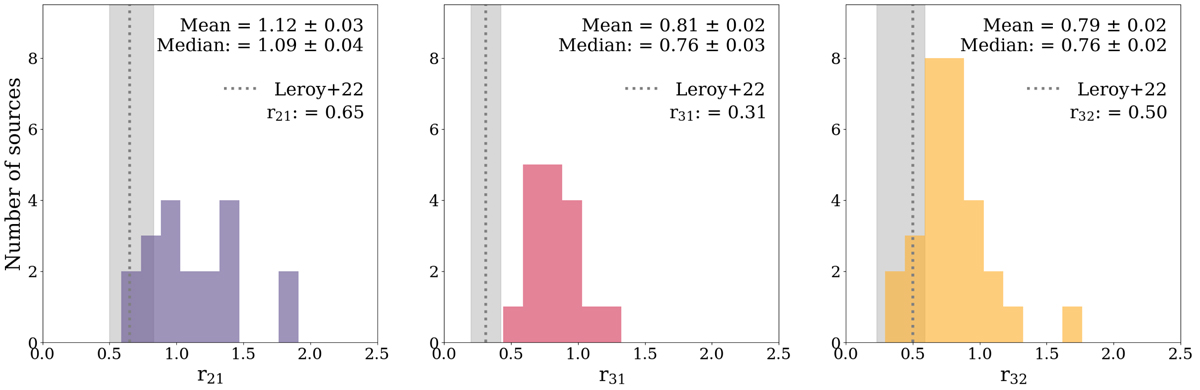
Distribution of galaxy-integrated CO line ratios obtained for our sample of ULIRGs, with mean and median values reported at the top right of each plot. Left: ![]() . Middle:
. Middle: ![]() . Right:
. Right: ![]() . The mean CO line ratios measured by Leroy et al. (2022) in local massive main-sequence disk galaxies are shown using vertical dotted lines, with the gray shaded regions representing their 16-84 velocity percentile ranges.
. The mean CO line ratios measured by Leroy et al. (2022) in local massive main-sequence disk galaxies are shown using vertical dotted lines, with the gray shaded regions representing their 16-84 velocity percentile ranges.
Current usage metrics show cumulative count of Article Views (full-text article views including HTML views, PDF and ePub downloads, according to the available data) and Abstracts Views on Vision4Press platform.
Data correspond to usage on the plateform after 2015. The current usage metrics is available 48-96 hours after online publication and is updated daily on week days.
Initial download of the metrics may take a while.